
These three cryptocurrency analysts failed to accurately predict the crypto market in October, particularly regarding the Bitcoin (BTC) price.
It can be difficult to time or predict the correct movements in the market. Even some of the best in the business get it wrong. BeInCrypto examines the instances where crypto analysts made inaccurate Bitcoin predictions in October.
Channel Breakdown Does Not Lead to Further Decrease
On October 14, well-known cryptocurrency analyst TheMoonCarl tweeted a Bitcoin chart showing the price breaking down from an ascending parallel channel. Such channels contain corrective movements and are expected to lead to breakdowns.
Due to the breakdown, TheMoonCarl gave a target of $25,000 for the ensuing movement created by the September lows.
Empower your investments with price predictions: Bitcoin (BTC) Price Prediction
However, the price did not decrease. Rather, it reversed immediately after the breakdown (green circle) and initially made an unsuccessful attempt at breaking out (red icon) before successfully breaking out from the channel on October 20.
The BTC price reached a new yearly high of $35,198 on October 24 before falling slightly. The price is currently making another attempt at moving above $35,000.
Cryptocurrency Analysts Fractal Proves Invalid
Well-known crypto analysts RektCapital and Profit8lue both posted a variation of a rounded-top pattern, which is expected to lead to a considerable fall.
While RektCapital predicted a drop to $20,000, Profit8lue believed that the price would fall to $12,000. For the bearish outline to be invalid, RektCapital posted the following criteria:
Bitcoin Bearish Fractal Invalidation Criteria a) Bull Market Support Band holds as support b) Weekly Close beyond Lower High resistance c) Breach of $31k yearly highs
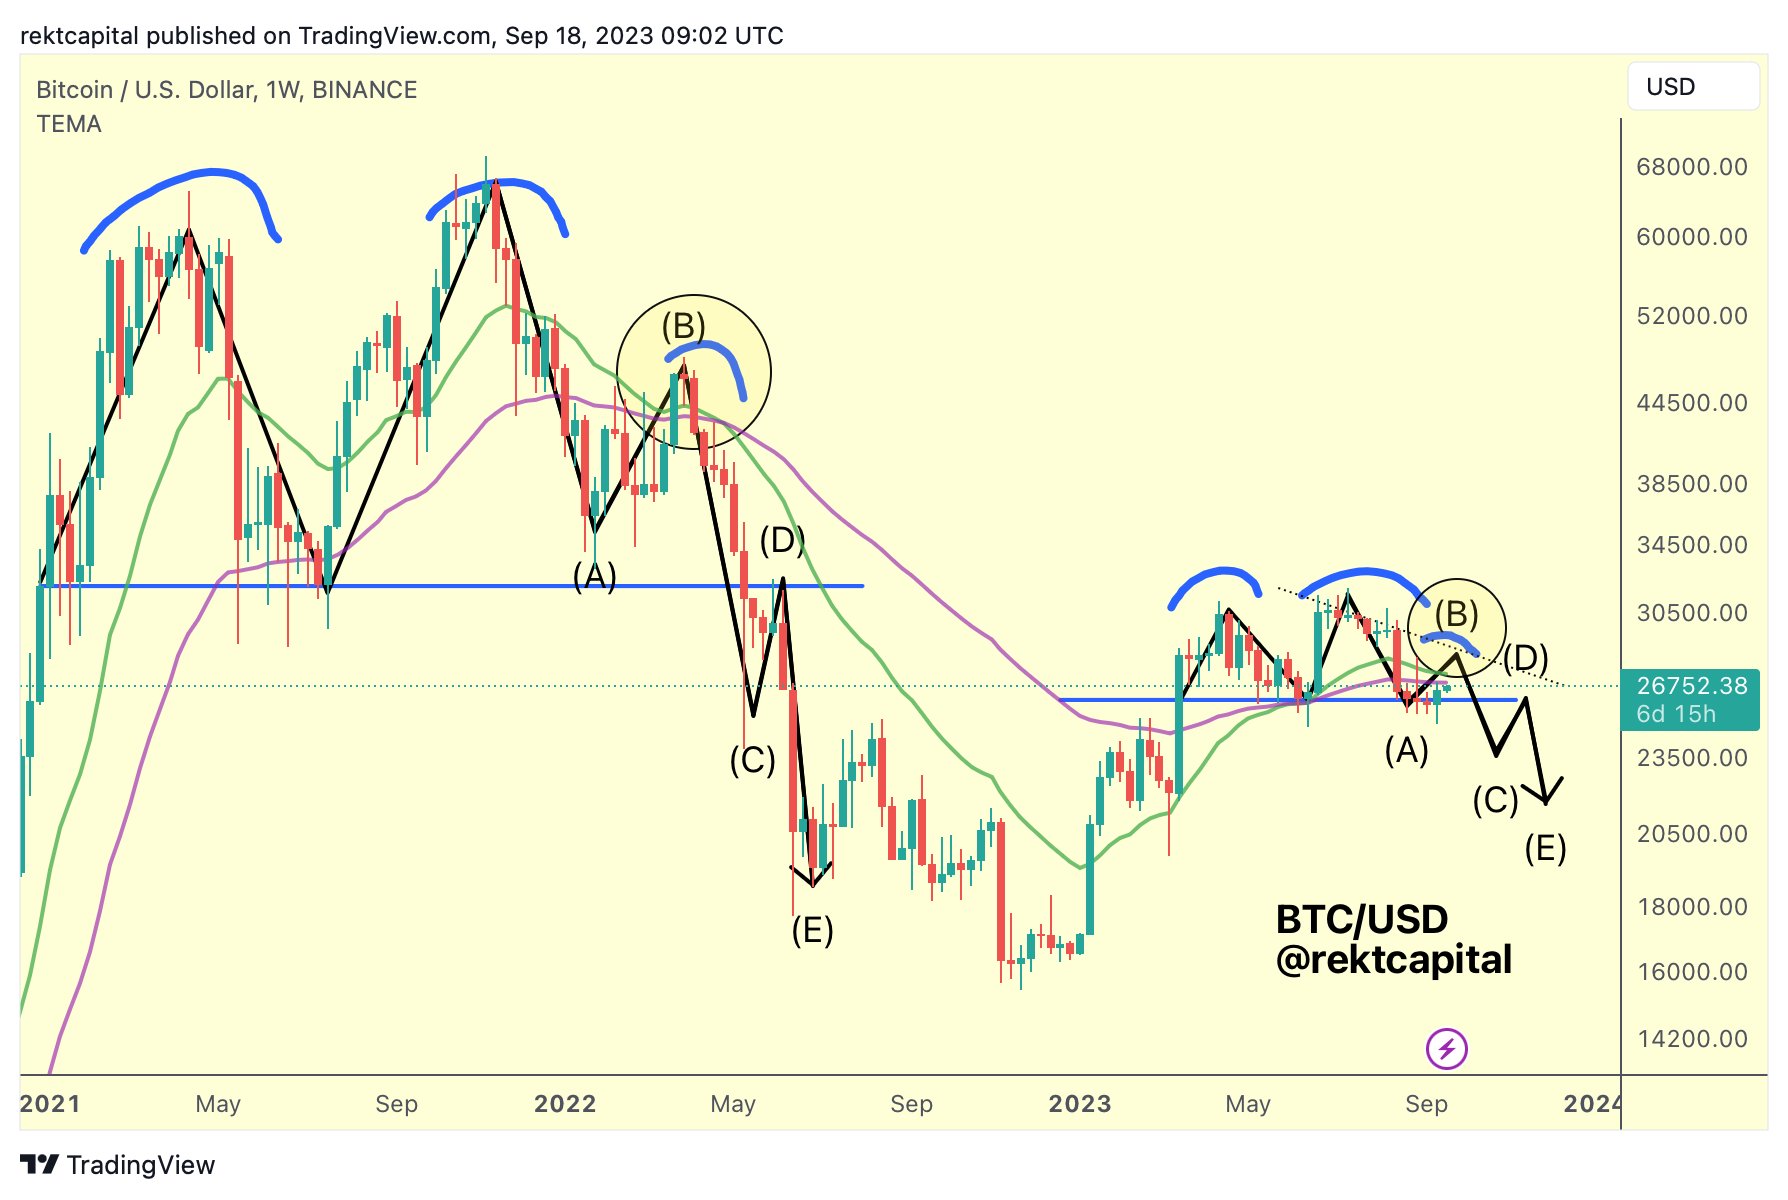
Neither scenario proved true. Rather, the BTC price increased considerably, breaking out from the descending resistance trendline, the $31,300 resistance area, and reached its yearly high of $35,198.
If BTC continues to increase, the next resistance will be at the 1.61 external Fib retracement resistance at $36,000, 3.50% above the current price. The closest horizontal resistance is at $40,000, 15% above the current price.
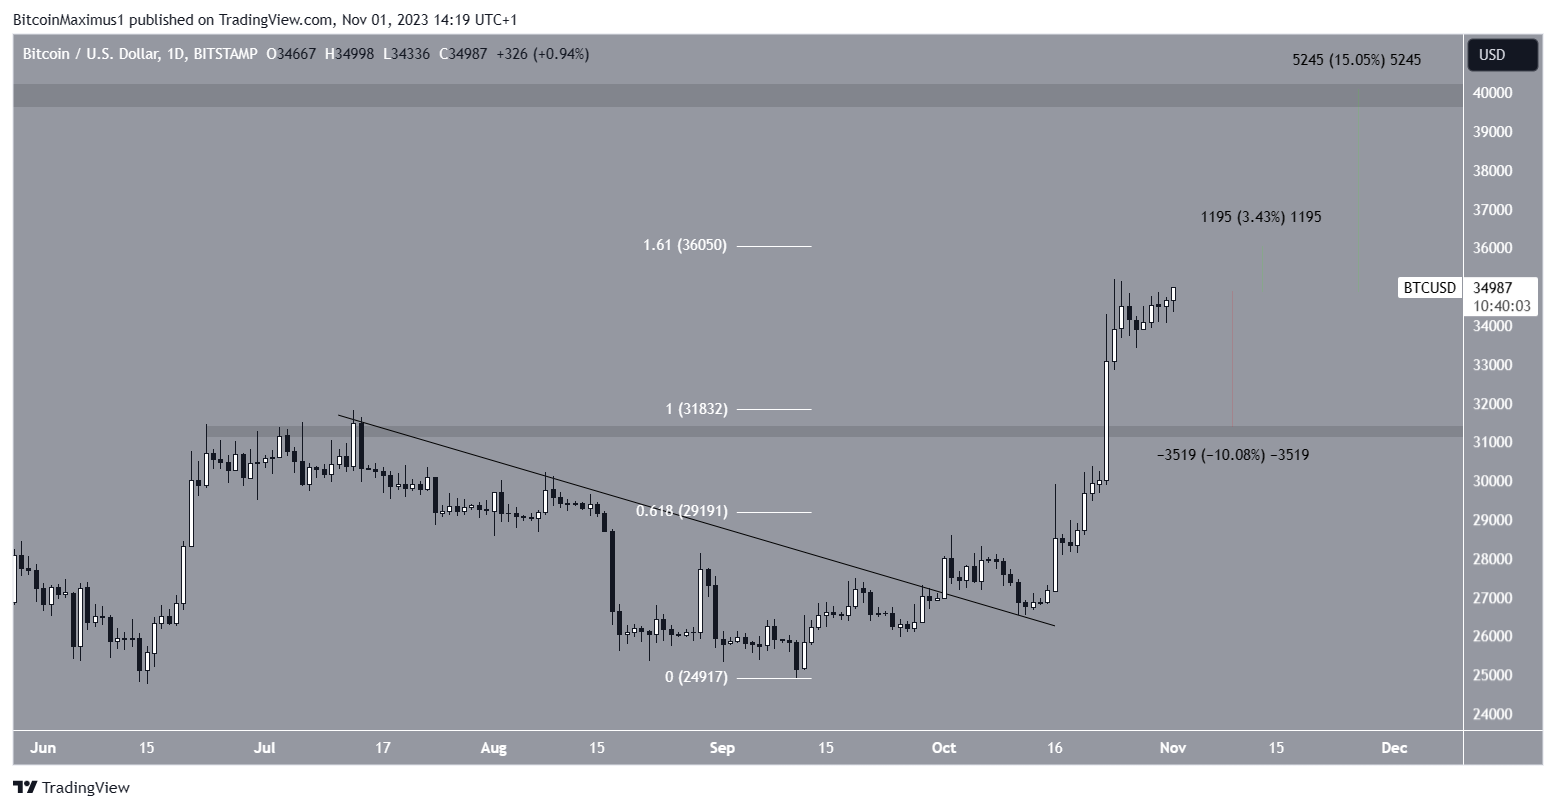
Despite this bullish BTC price prediction, a rejection from the $35,000 resistance can cause a 10% drop to the closest support at $31,300.
Read More: 9 Best AI Crypto Trading Bots to Maximize Your Profits
For BeInCrypto’s latest crypto market analysis, click here.
The post These Crypto Analysts Failed to Time Bitcoin in October appeared first on BeInCrypto.