The Ethereum (ETH) price has underperformed several major cryptocurrencies this year, only increasing by 90%.
The price still broke out above a critical resistance area in December. Can this be the start of a significant rally?
Ethereum Moves Above 550-Day Resistance
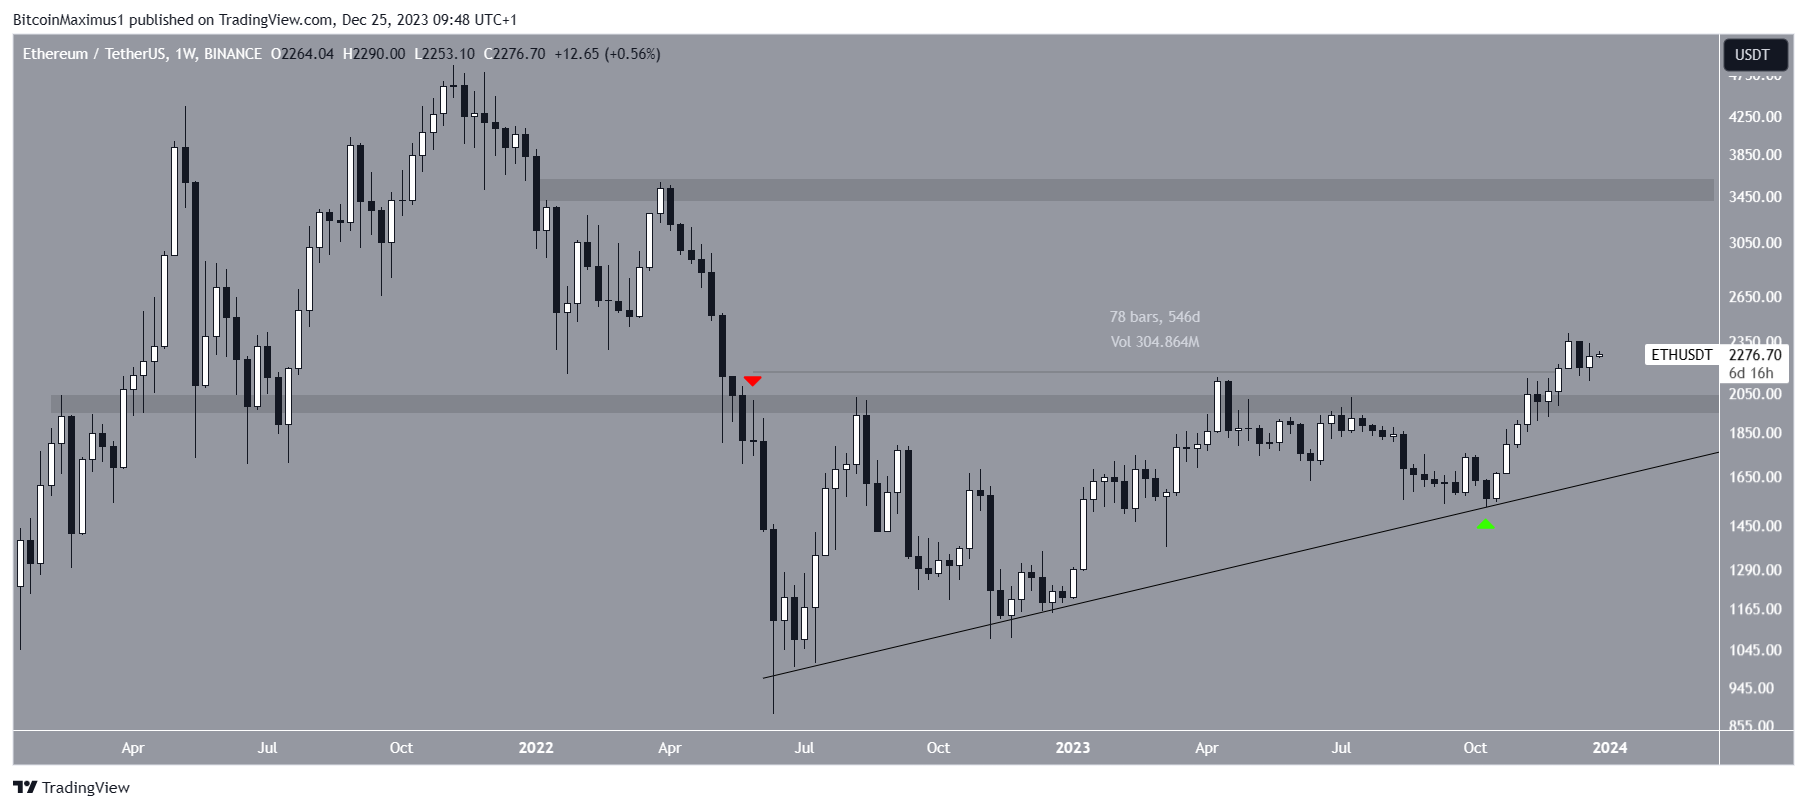
The Ethereum price has increased alongside an ascending support trend line since May. The trend line was recently validated in October (green icon).
The rally accelerated after the bounce, leading to a new yearly high of $2,403 on December 8. The ETH increase was also important since it caused a breakout from a 550-day horizontal resistance area.
Moreover, the area had previously acted as support since April 2021 before turning to resistance in May 2022 (red icon).
Cryptocurrency analyst and trader Pentoshi is bullish on Ethereum because of the upcoming ETF. He tweeted:
“We’ve been bull tweeting the $BTC etf since 25-28k Soon, we get to do this all again with the $ETH ETF in 2024 No matter what you believe, it’s all game theory. as the date approaches people will be less willing to sell, and others will feel the need to buy $2,7xx and 3.4k on the table.”
Well-known analyst Inmortal is also bullish, though he uses range trading to come to his conclusion.
Read More: Ethereum (ETH) Merge: All You Need to Know
ETH Price Prediction: Indicator Predicts Rapid Increase
With the RSI as a momentum indicator, traders can determine whether a market is overbought or oversold and decide whether to accumulate or sell an asset.
Bulls have an advantage if the RSI reading is above 50 and the trend is upward, but if the reading is below 50, the opposite is true.
The RSI is increasing and above 50, both bullish signs.
Read More: How to Buy Ethereum (ETH)
More importantly, the indicator has nearly crossed into overbought territory. It did this three times in the previous cycle (green). Each led to a significant upward movement, ranging from 105% to 340%.
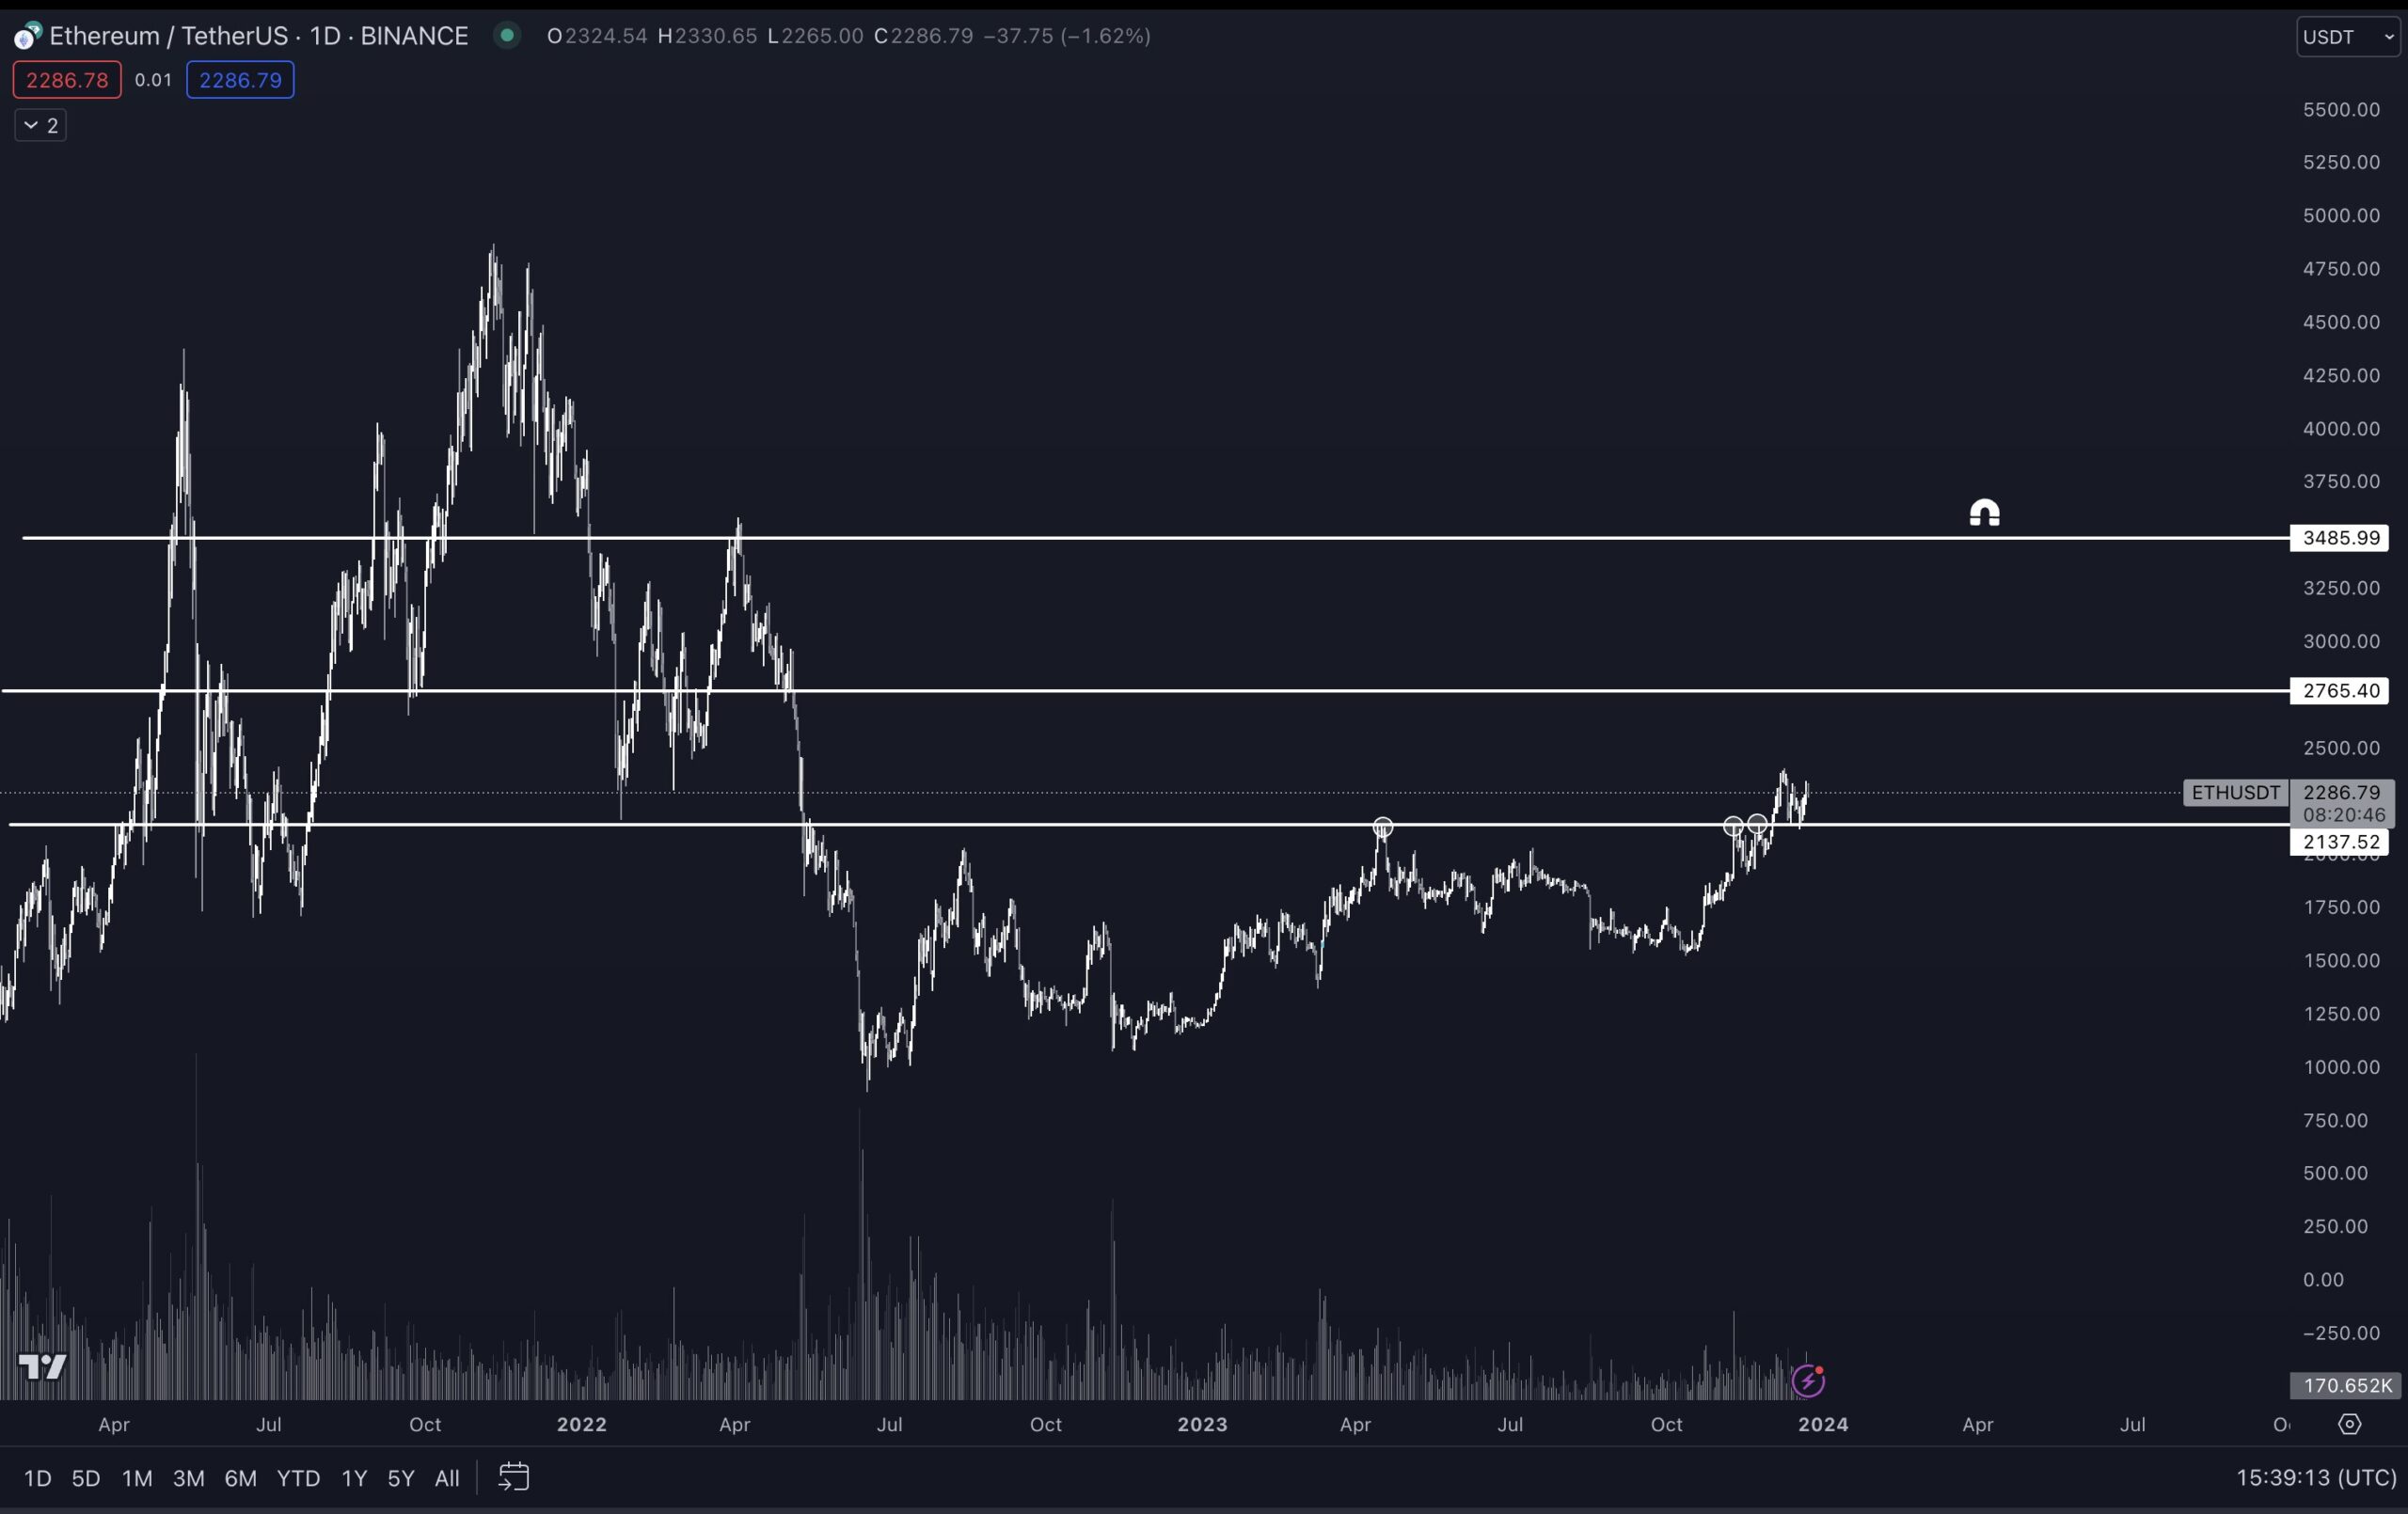
In the current movement, the closest resistance area at $3,400 is 55% above the current Ethereum price, while the all-time high is 105% above it.
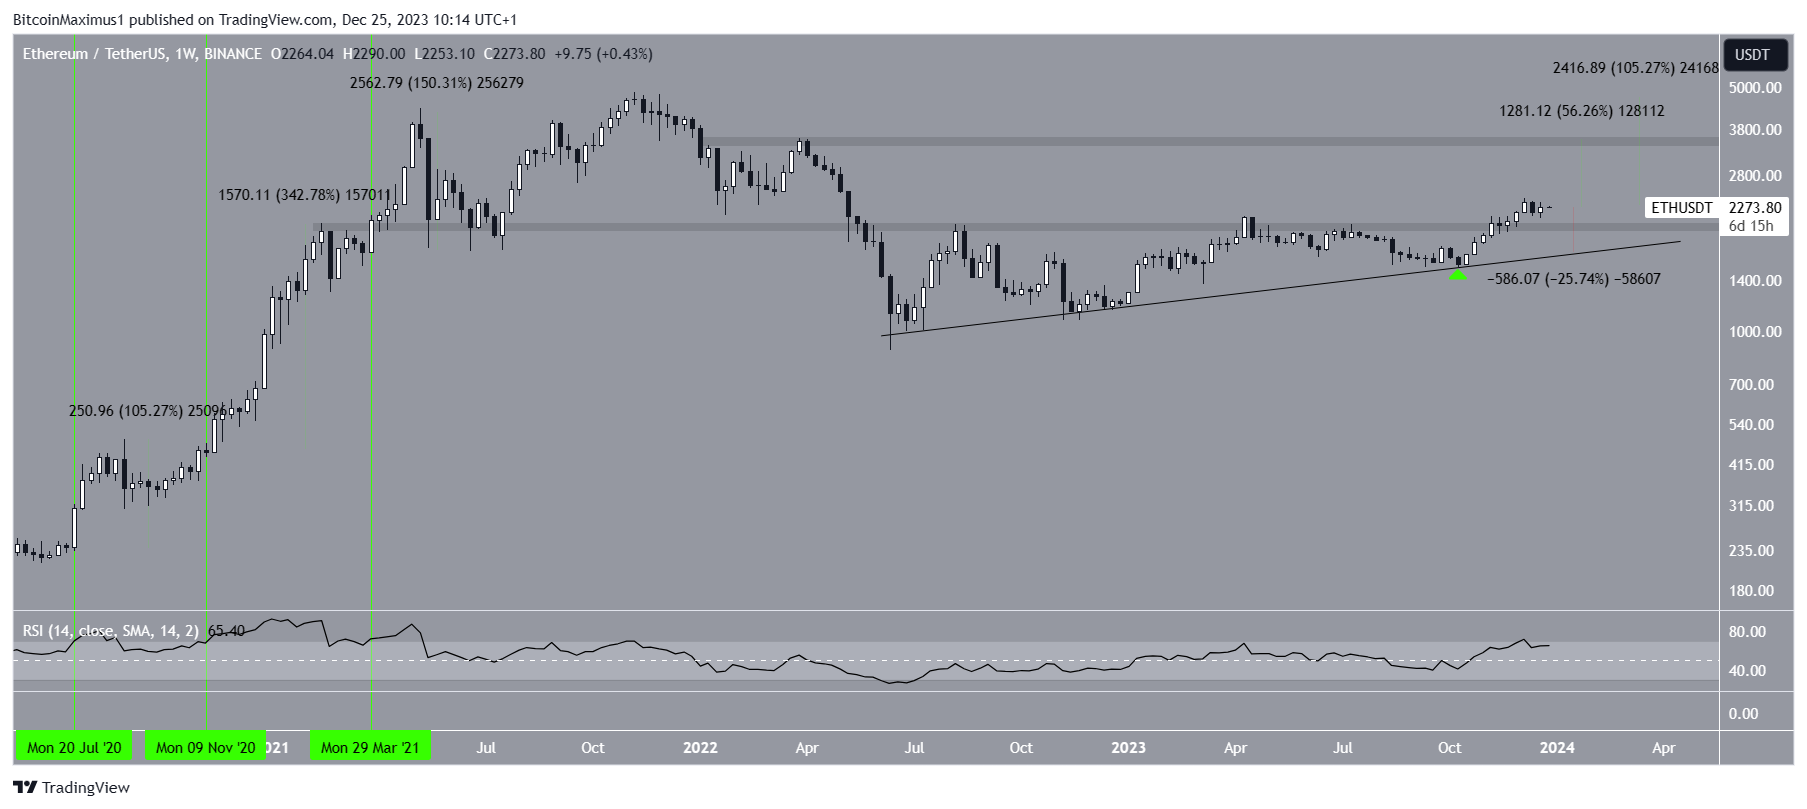
Despite the bullish ETH price prediction, a close below the $2,000 horizontal area could trigger a 25% decrease to the ascending support trend line at $1,650.
For BeInCrypto’s latest crypto market analysis, click here.
Top crypto platforms | December 2023
![]()
Kraken
Kraken” target=”_blank”>Explore →
![]()
KuCoin
KuCoin” target=”_blank”>Explore →
![]()
BYDFi
BYDFi” target=”_blank”>Explore →
![]()
MEXC
MEXC” target=”_blank”>Explore →
Explore more
The post This Ethereum (ETH) Signal Previously Led to a 100% Increase—Will History Repeat? appeared first on BeInCrypto.