 Trading Signal Has Not Been Seen This Low Since 2018 – What Does It Mean?")
The Ethereum (ETH) price has increased since reaching a 214-day low on August 12.
The bounce confirmed a long-term bullish divergence in the daily Relative Strength Index (RSI). So, what does this mean for the price of Ethereum?
Ethereum Bounces After 214-Day Low
The daily time frame chart shows that the ETH price has decreased inside a descending parallel channel since April.
The decrease caused a breakdown from the $1,650 horizontal support area and led to a low of $1,521 on October 12. This was the lowest price in 214 days.
The Ethereum price has increased since, in a movement preceded by a bullish divergence in the daily Ethereum RSI (green trendline).
Crypto investing, simplified. Get Ethereum (ETH) price predictions here.
With the RSI as a momentum indicator, traders can determine whether a market is overbought or oversold and decide whether to accumulate or sell an asset.
If the RSI reading is above 50 and the trend is upward, bulls have an advantage, but if the reading is below 50, the opposite is true.
A bullish divergence occurs when a momentum increase accompanies a price decrease. It is considered a bullish sign. The divergence occurred after the indicator reached a low of 18 on August 18.
News for the Ethereum network is mixed. The ongoing price decrease coincided with a three-year low in gas fees. This raises concerns about Ethereum’s future trajectory.
However, analysts from the international bank Standard Chartered predicted that the ETH price will reach $8,000 by the end of 2026.
Also, they stated that the long-term valuation for the cryptocurrency is between $26,000 – $35,000.
Check out the 9 best AI crypto trading bots to maximize your profits.
Just How Rare is this RSI Signal?
A closer look at the historical Ethereum RSI readings shows just how rare this bullish divergence is.
The low of 20 is the lowest RSI value since December 2018, when the indicator fell to 18. Such extremely oversold values are often indicative of a price bottom.
The RSI did not reach 20 even during its March 2020 ETH price crash (red icon).
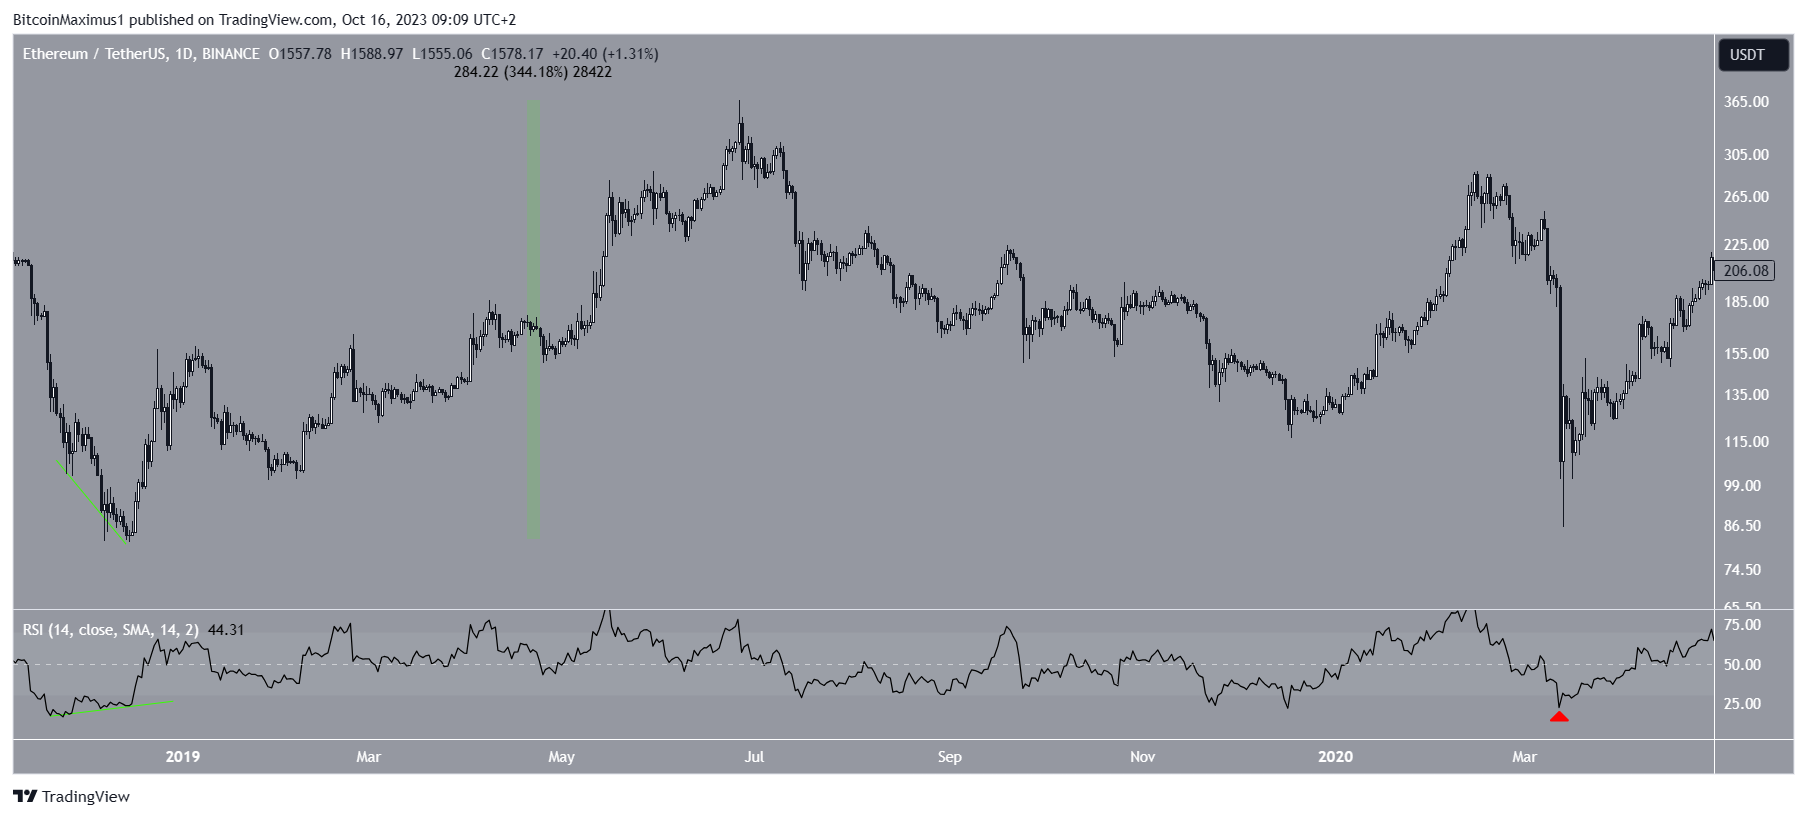
Interestingly, December 2018 is the only other time in Ethereum’s price history that the indicator created bullish divergence inside its oversold territory (green trendline).
After the divergence, the price increased by 345%.
ETH Price Prediction: Where to Next?
Due to the RSI readings and the price action, the most likely ETH price prediction is bullish.
Since the descending parallel channel is considered a corrective pattern, an eventual breakout from it is expected. The aforementioned bullish divergence in the RSI could catalyze this.
In case of a breakout, the Ethereum price can increase by 33% and reach the $21,00 horizontal resistance area.
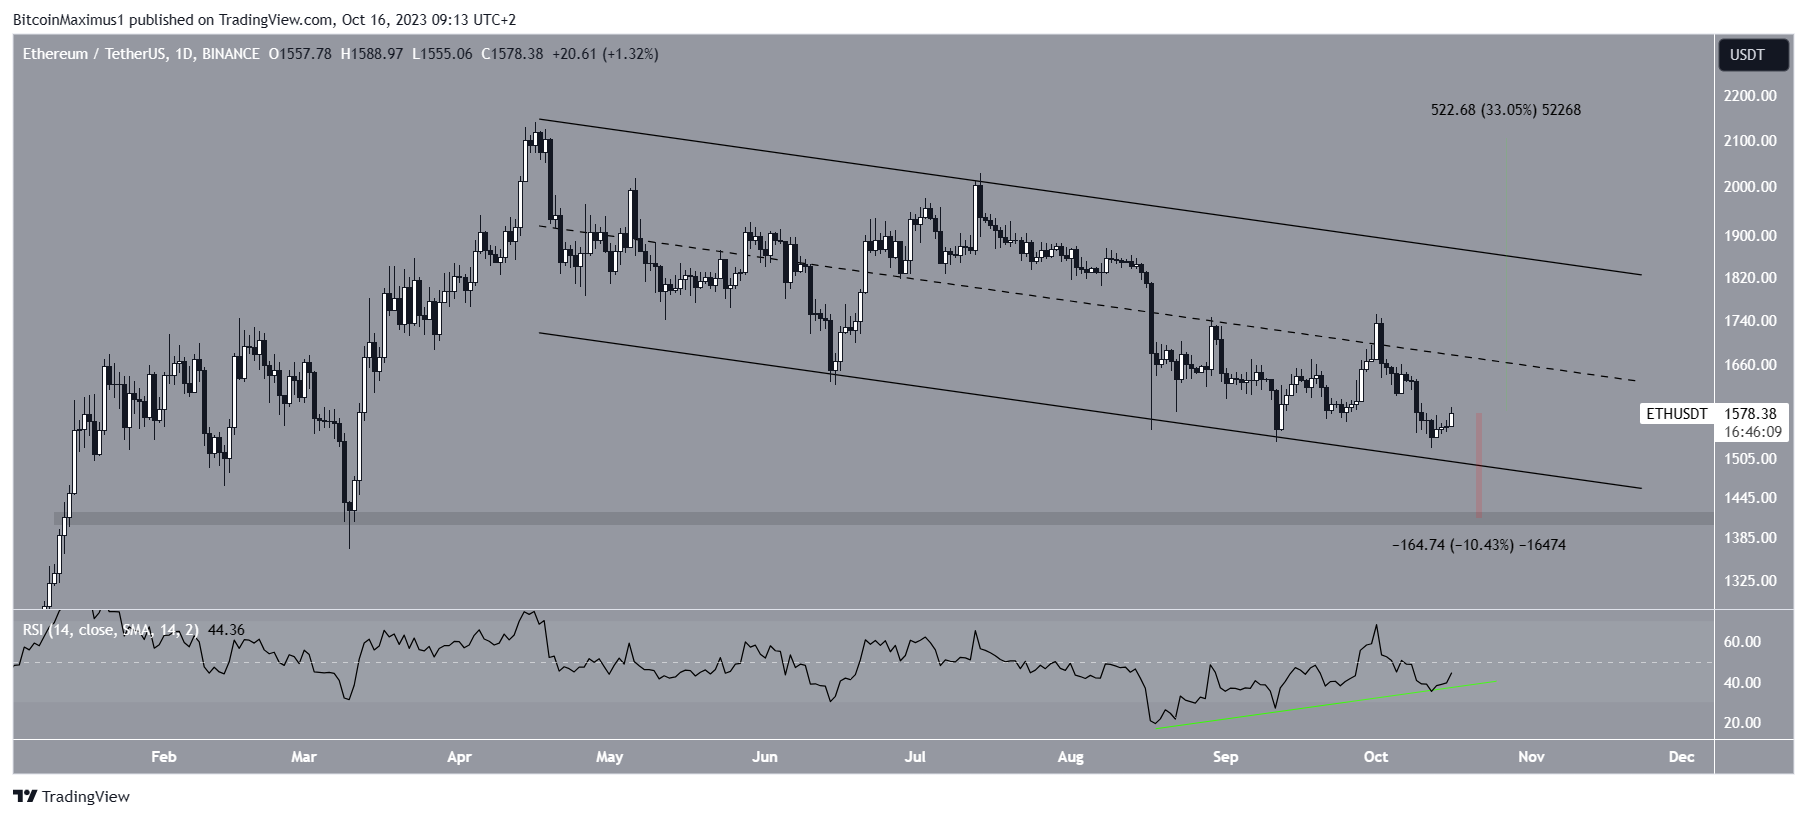
Despite this bullish ETH price prediction, a breakdown from the channel will invalidate the divergence and can lead to a 10% drop to the next closest support area at $1,400.
Looking to be profitable? Learn how to make money in a bear market.
For BeInCrypto’s latest crypto market analysis, click here.
The post This Ethereum (ETH) Trading Signal Has Not Been Seen This Low Since 2018 – What Does It Mean? appeared first on BeInCrypto.