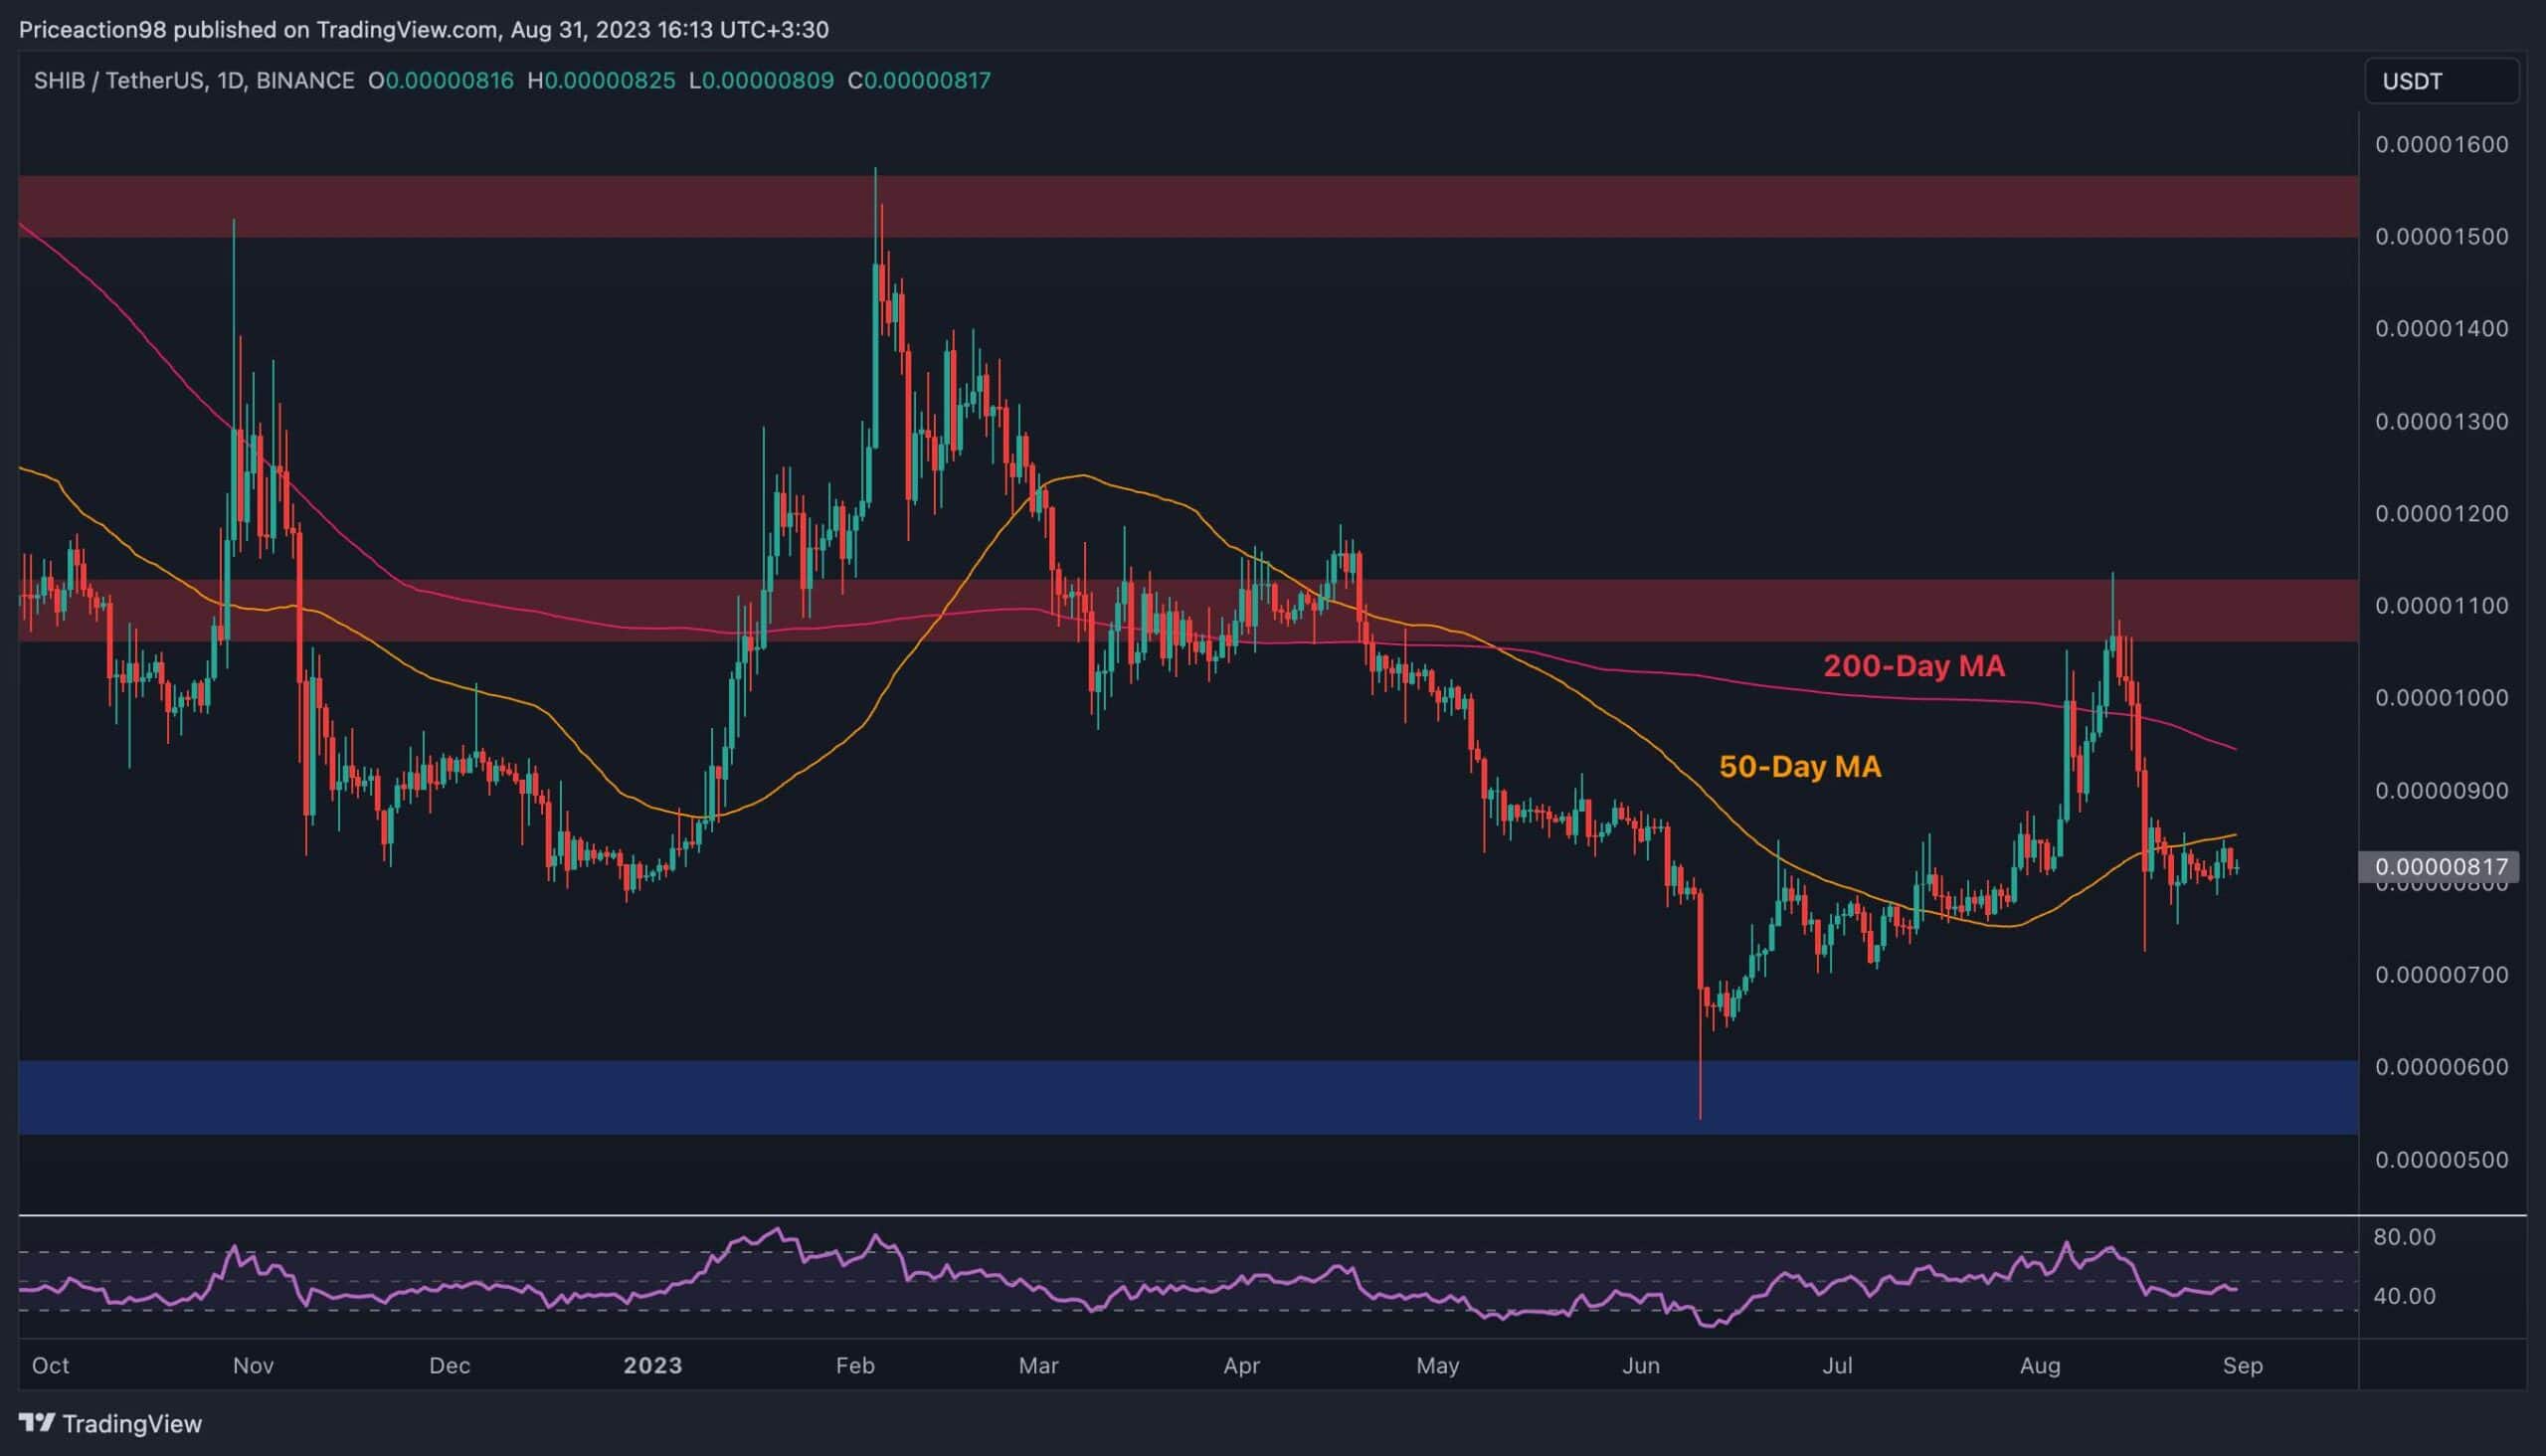
Shiba Inu’s native token has been demonstrating bearish price action over the past few weeks since getting rejected at a critical resistance level. Yet, a more severe decline may still occur in the short term.
Technical Analysis
By Edris
The SHIB/USDT Chart
On the USDT-paired chart, the price has been rejected from the $0.000011 resistance level, leading to an impulsive drop below the 50-day and the 200-day moving averages located around the $0.0000085 and $0.0000095 levels, respectively.
The 50-day moving average is currently driving the price down, preventing a possible recovery. If SHIB fails to climb above the mentioned moving average’s resistance line, it will likely target the significant $0.000006 support zone in the next few weeks.
The SHIB/BTC Chart
Looking at the Bitcoin pair chart, things are quite similar. The price has been rejected from the 0.035 SAT resistance level and has decreased since.
The 50-day moving average currently provides support around the 0.03 SAT mark, and it could initiate a rally and retest of the 0.035 SAT if it holds. On the other hand, a bearish breakout could result in a drop toward the 0.024 SAT zone, which could be the investors’ last resort.
Binance Free $100 (Exclusive): Use this link to register and receive $100 free and 10% off fees on Binance Futures first month (terms).
PrimeXBT Special Offer: Use this link to register & enter CRYPTOPOTATO50 code to receive up to $7,000 on your deposits.
Disclaimer: Information found on CryptoPotato is those of writers quoted. It does not represent the opinions of CryptoPotato on whether to buy, sell, or hold any investments. You are advised to conduct your own research before making any investment decisions. Use provided information at your own risk. See Disclaimer for more information.
Cryptocurrency charts by TradingView.
