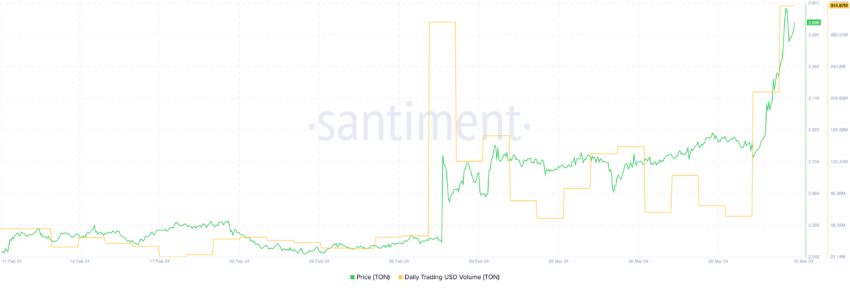
TON’s daily trading volume has surged to new all-time highs, surpassing a staggering $314 million. Despite this recent increase, TON’s EMA lines indicate a bullish trend and potential for further price gains.
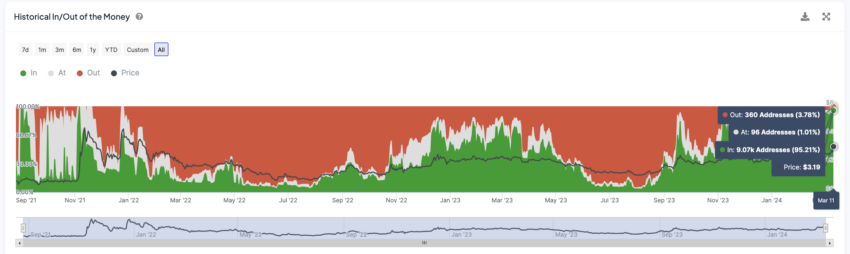
However, a potential cause for concern is the high percentage of profitable holders, currently at 95% – the highest level since 2021. Historically, this suggests that selling pressure may be on the horizon. Is this a buying opportunity or a sign to wait?
TON Daily Trading Volume Is Reaching New Records
The TON Daily Trading Volume has recently surged to an unprecedented level, achieving a new all-time high with an impressive figure of $314 million. This remarkable milestone surpasses the previous record, which was set just two weeks prior, on February 28, with a trading volume of $295 million. Notably, a significant and consistent trend has been observed between the TON price movements and its trading volume, indicating a strong correlation between the two.
Such a pattern suggests that as the trading volume increases, the TON price tends to follow suit, thereby highlighting the increasing momentum of the token. This trend is particularly noteworthy as it may signal a positive outlook for TON, suggesting that the token is gaining substantial traction within the market.
As a result, there is growing optimism among investors and market observers that the upward trend in both trading volume and token price could potentially continue in the foreseeable future, thereby reinforcing the positive momentum surrounding TON.
Read More: 8 Best Crypto Platforms for Futures Copy Trading
The Majority of Holders Are Now Profitable
Analyzing the distribution of TON holders based on their profit and loss positions paints a fascinating picture. Over 95% of TON holders are currently sitting on profits, marking the highest profitability level since 2021. This statistic, derived from the “in/out of the money” metric, offers valuable insight into investor sentiment.
This metric calculates the average price at which different addresses acquired TON tokens. If the current market price surpasses the cost basis (average acquisition price) for a particular address, that address is classified as “in the money,” indicating a potential profit. Conversely, addresses where the current price is lower than the cost basis are considered “out of the money,” suggesting unrealized losses.
While the high percentage of profitable holders might raise concerns about a potential sell-off, historical trends suggest a more nuanced perspective. There have been instances where many profitable holders haven’t triggered a sustained downtrend. Furthermore, TON has significant room for growth before reaching its previous all-time high. The price needs to climb another 22.10% to revisit those peaks. This suggests that the market might still be in the accumulation phase. In that case, investors are potentially holding on to their positions in anticipation of further price appreciation.
However, it’s prudent to acknowledge the potential for selling pressure. The recent 37% price surge has undoubtedly placed many holders in a profitable position. Some might be tempted to lock in their gains by liquidating a portion of their holdings. This potential selling pressure should be monitored closely, particularly if it coincides with a weakening of the current uptrend signals identified through technical analysis.j
TON Price Prediction: Can It Reach $4?
The 4-hour chart for TON is giving bullish signals on multiple fronts. The recent crossover of the short-term EMAs above the long-term lines is a classic technical indicator suggesting an upward trend.
Exponential Moving Averages (EMAs) are metrics used in technical analysis to smooth out price fluctuations and identify trends. Adding to the bullish sentiment, the price of TON is currently trading above all the EMA lines on the chart. This further strengthens the uptrend signal as it suggests that the price momentum is currently to the upside.
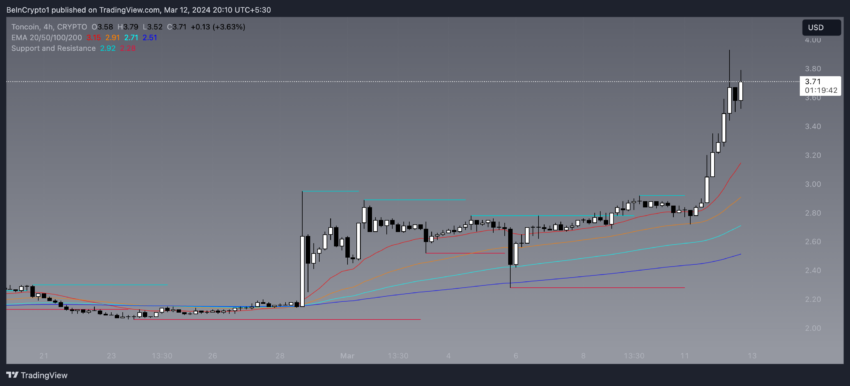
However, it’s important to consider potential support levels in case the price encounters resistance or a pullback. TON has historically found support around $2.6 and $2.38. If the price dips below these zones, it could indicate a temporary weakness and potentially lead to a drop towards $2.10.
On the other hand, good news could continue to raise TON’s price. The one recently shared on X stating that Telegram with reward channel owners with Toncoin is an example:
“The company (@telegram) will pay out rewards using Toncoin on the TON Blockchain. Channel owners will start receiving 50% of all revenue that the company makes from displaying ads in their channels,” the announcement stated.
If the current uptrend continues to gain traction, TON could see significant price appreciation. A surge past the $4 mark would represent a breakout to levels not seen since 2021, opening the door for potentially even higher prices.
Read More: 10 Best Crypto Exchanges and Apps for Beginners in 2024
Overall, the technical analysis of the 4-hour chart for TON suggests a bullish outlook, with the EMAs and current price position providing positive signals. However, traders should also be aware of potential support levels and be prepared to adjust their strategies accordingly.
The post Toncoin (TON) Price Climbs 37%: Here’s Why Profitable Holders Could Stop the Uptrend appeared first on BeInCrypto.