
The Ethereum (ETH) price has fallen since its yearly high of $2,403 on December 9.
The rejection occurred at a confluence of resistance levels. Will the ETH price regain its footing, or is this the beginning of a correction?
Ethereum Gets Rejected at Long-Term Resistance
The weekly time frame technical analysis shows that the Ethereum price has increased since May 2022. During this time, it created two higher lows (green icons), accelerating its rate of increase after each of them.
During this time, the ETH price followed an ascending resistance trend line. More recently, the trend line was validated two weeks ago when ETH reached its yearly high of $2,400 (red icon).
The rejection coincided with a validation of horizontal and Fib resistance.
The RSI is a momentum indicator traders use to evaluate whether a market is overbought or oversold and whether to accumulate or sell an asset.
Readings above 50 and an upward trend suggest that bulls still have an advantage, while readings below 50 indicate the opposite. Despite a slight dip last week, the weekly RSI is increasing and is above 50.
Read More: 9 Best AI Crypto Trading Bots to Maximize Your Profits
Peter Brandt Shorts Ethereum
Well-known analyst and trader Peter Brandt is bearish on Ethereum because of a long-term breakdown. He stated that:
Classical chart patterns in price charts are not sacred – they fail to perform according to the textbooks all the time But, if the rising wedge in Ethereum $ETH complies with the script, the target is $1,000, then $650 I shorted ETH on Friday — I have a protective B/E stop
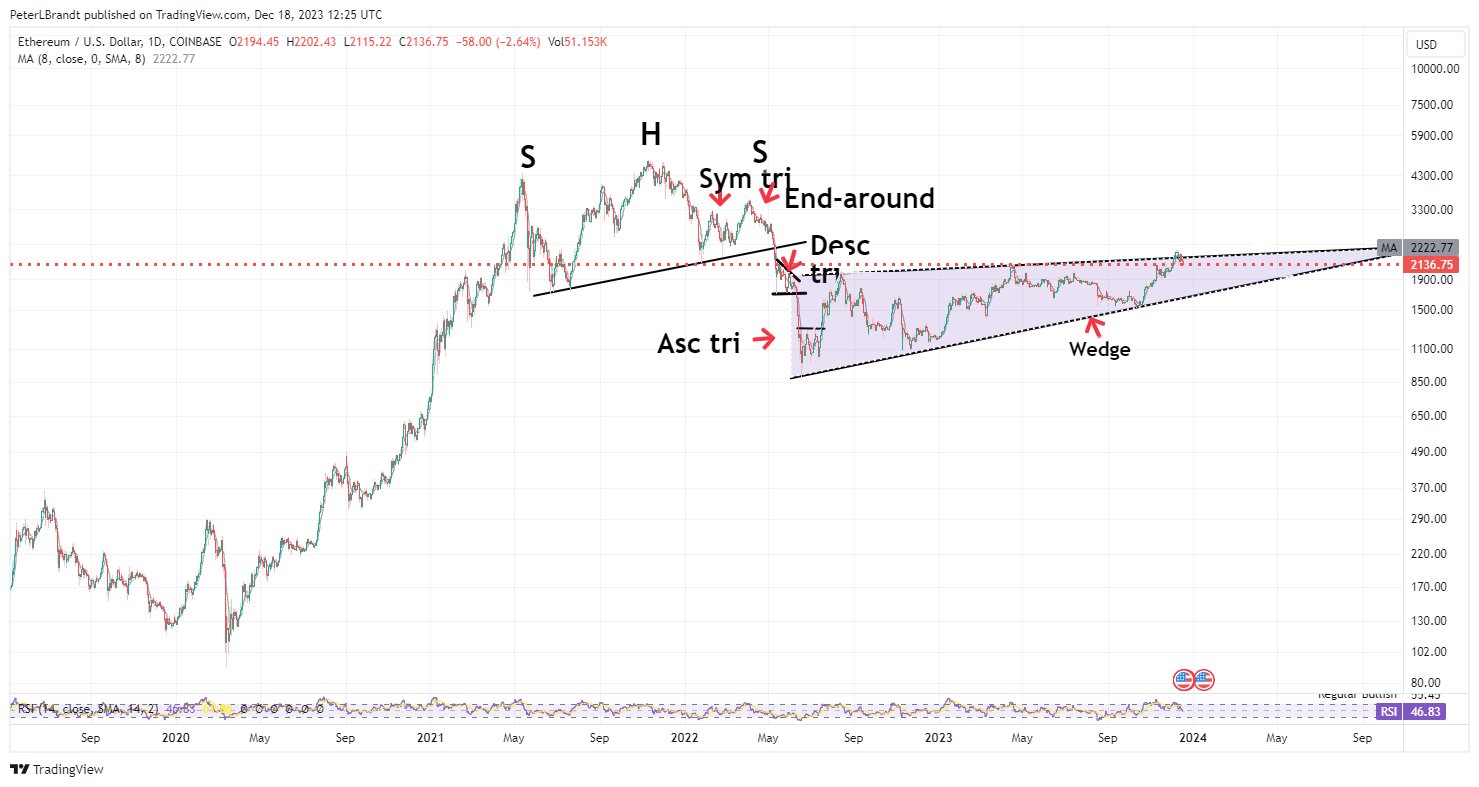
The wedge’s resistance trend line is the same as the previous one. The resistance is crucial since it coincides with the 0.382 Fib retracement resistance level and the $2,420 horizontal resistance area. So, whether the price is reclaimed will be key for the future trend.
The ascending wedge’s trend line is at $1,720.
ETH Price Prediction: Has the Correction Begun?
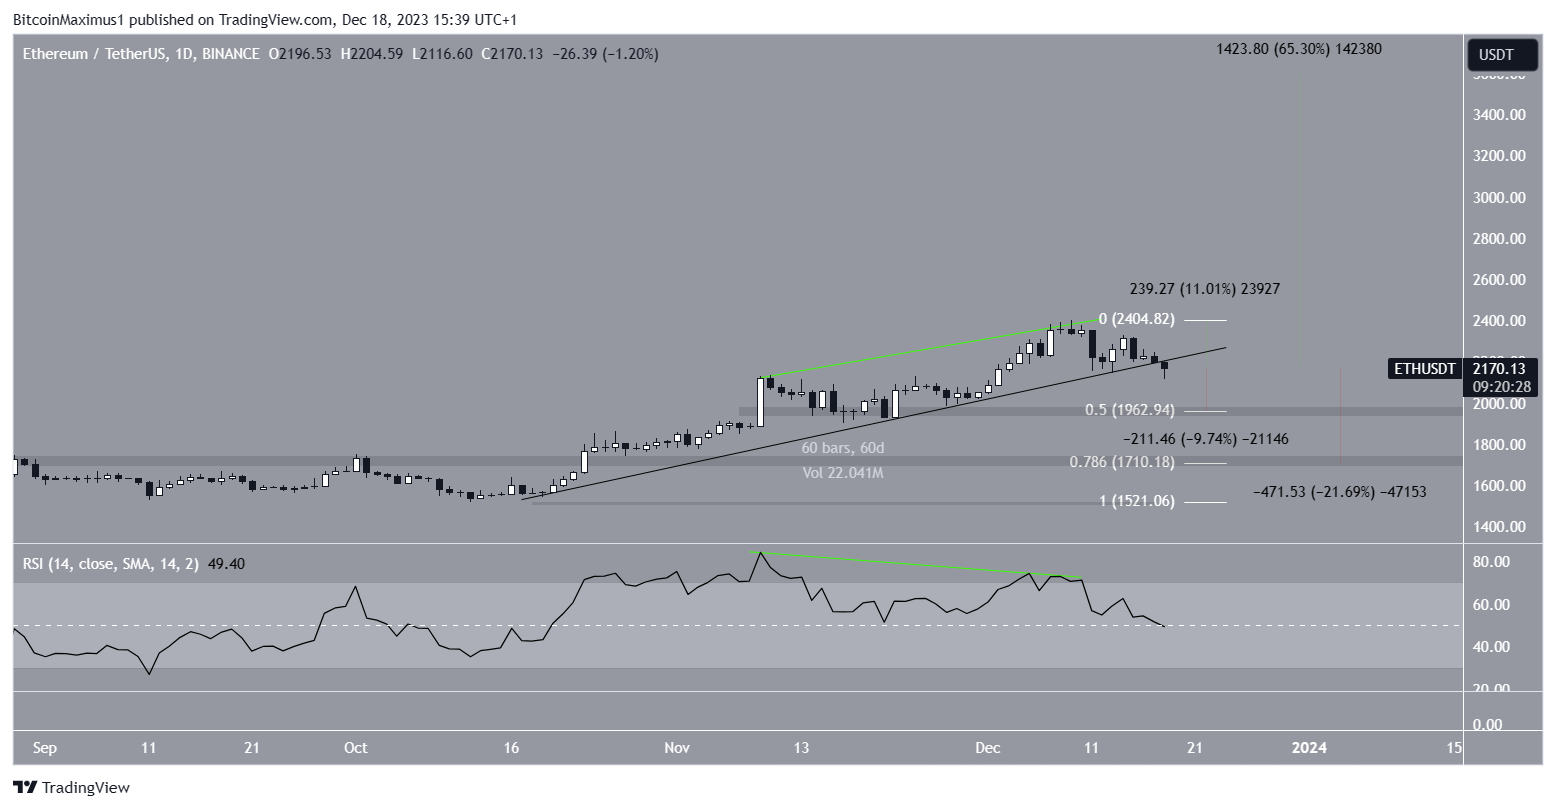
The daily time frame gives a bearish reading because of the price action and the RSI, supporting the bearish analysis given by Peter Brandt.
The price action shows that the ETH price broke down from an ascending support trend line that had been in place for 60 days. Breakdowns from such structures usually indicate that the previous move has ended and a new one has begun in the other direction.
This breakdown is supported by the daily RSI, which generated a bearish divergence (green) before the decrease.
If the downward movement continues, the ETH price can fall 10% to the closest support at $1,960. It is worth noting that this will not confirm the breakdown from the ascending wedge.
This will only be done with a breakdown below the 0.786 Fib and horizontal support level at $1,710, 22% below the current price.
Despite this bearish ETH price prediction, reclaiming the ascending support trend line will invalidate the short-term breakdown and lead to a 12% increase to the yearly high.
A weekly close above the yearly high of $2,400 will be required to invalidate the long-term bearish pattern. Then, ETH can increase by 65% to the next long-term resistance at $3,600.
For BeInCrypto’s latest crypto market analysis, click here.
Top crypto platforms | December 2023
![]()
CoinDCX
CoinDCX” target=”_blank”>Explore →
![]()
Kraken
Kraken” target=”_blank”>Explore →
![]()
KuCoin
KuCoin” target=”_blank”>Explore →
![]()
BYDFi
BYDFi” target=”_blank”>Explore →
![]()
MEXC
MEXC” target=”_blank”>Explore →
Explore more
The post Trading Veteran Peter Brandt Shorted Ethereum (ETH), Targets $650 appeared first on BeInCrypto.