
Quick Take
A deep analysis of Bitcoin transactions and their correlation with working hours across major geographical regions reveals a striking disparity in price performance.
Analyzing 8 am to 8 pm Eastern Time, Central European Time, and China Standard Time for the U.S., Europe, and Asia, respectively, allows insights into Bitcoin price change within work hours in each region.
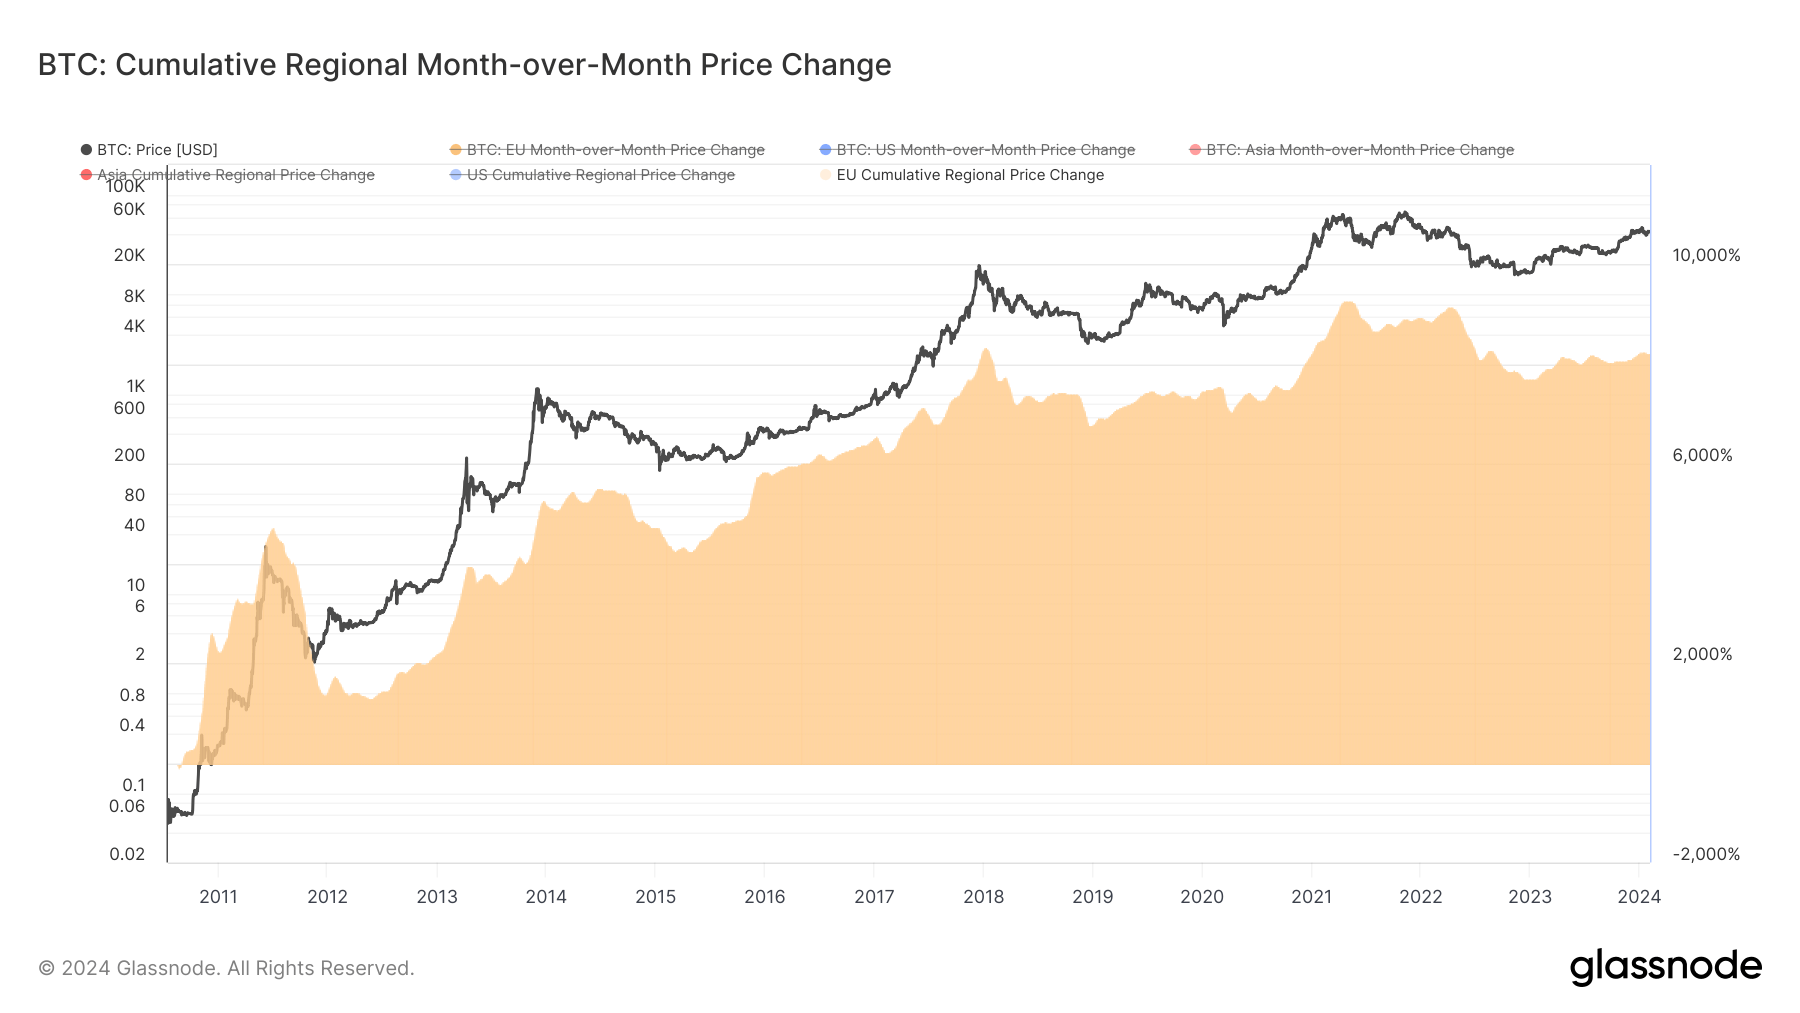
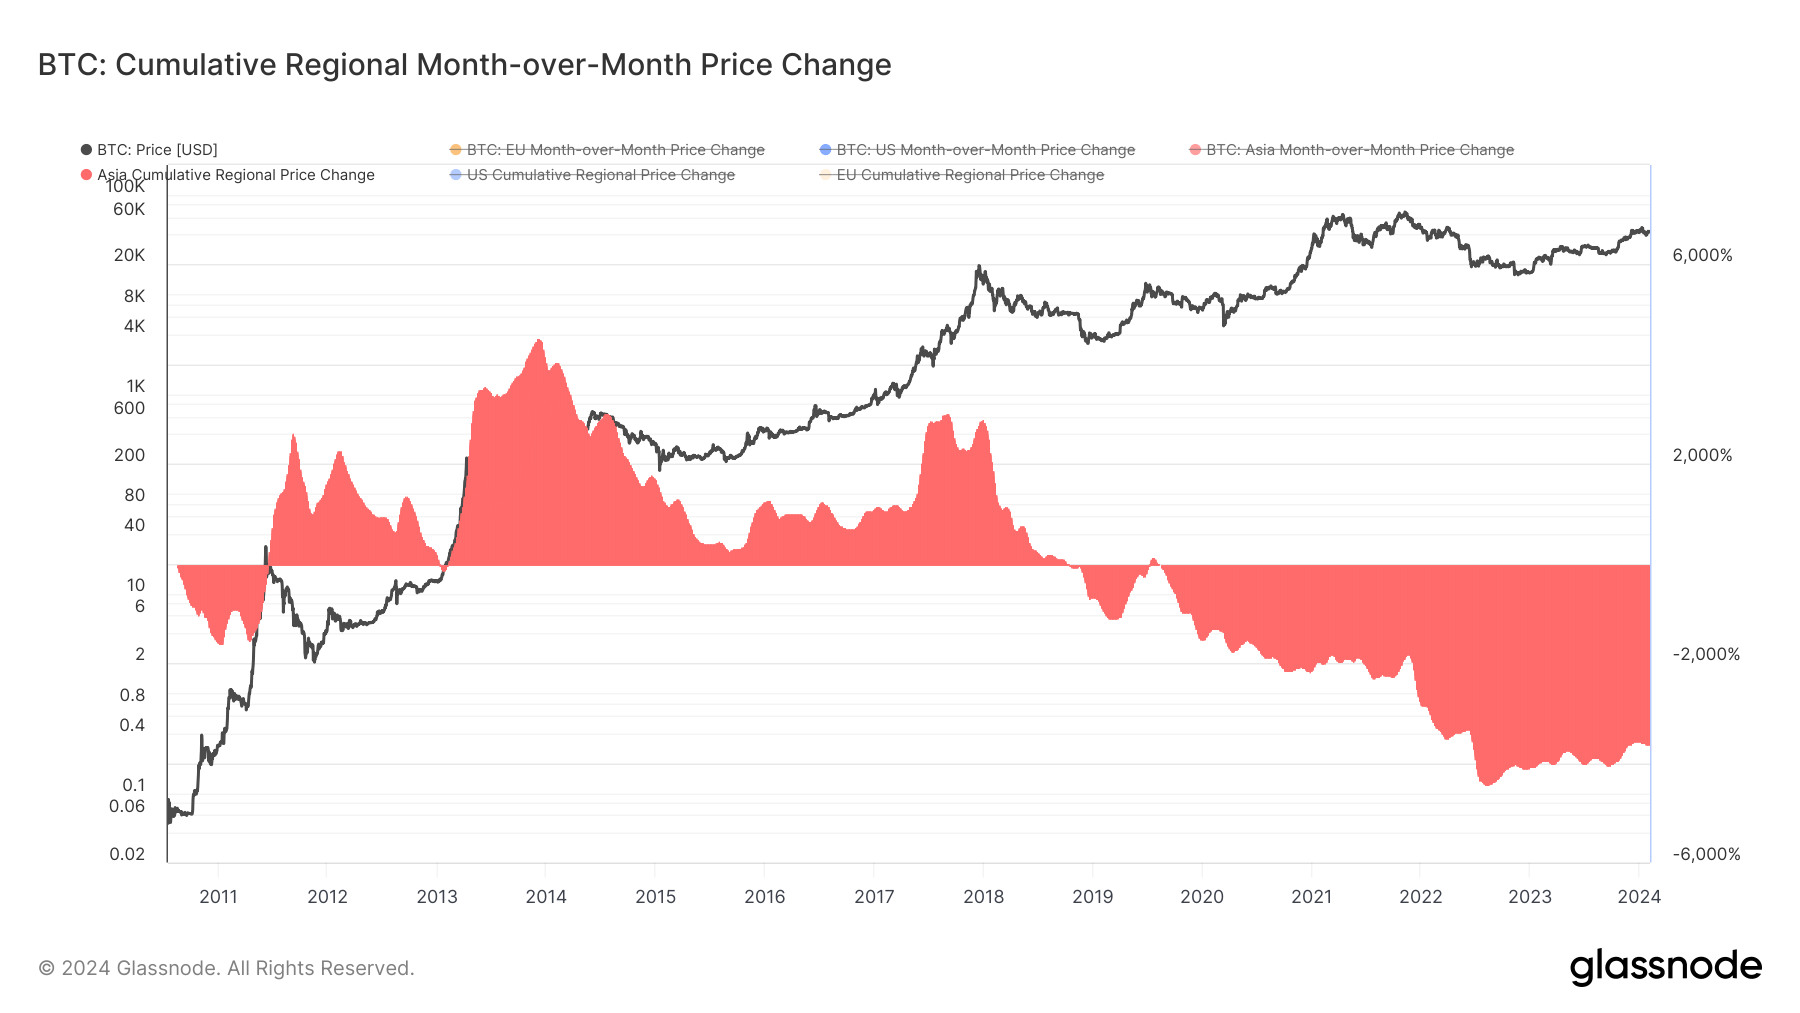
Looking at the month-on-month cumulative price change within each time period reveals notable discrepancies.
The United States, with its bullish stance on Bitcoin, leads the pack with a whopping 12,200% price change. This trend appears to strengthen as Bitcoin’s lifespan prolongs, suggesting an increasing favor towards the digital currency.
The U.S.’s bullish trend can be supported by the recent approval of spot BTC exchange-traded funds (ETFs), which have seen a total net inflow of $1.5 billion.
Despite a similar trajectory, Europe trails slightly, boasting a significant 8,000% price change. Despite falling short compared to the U.S., Europe’s performance demonstrates a steady confidence in Bitcoin’s potential.
However, the narrative differs starkly for Asia. Once bullish, their stance flipped negative in 2019, and the region hasn’t recovered since, with an alarming negative 3,500% price change. Conversely, Asia’s negative performance may be traced back to multiple Bitcoin bans, notably in China, which saw a notable decline in the Bitcoin hash rate in 2021.
The post U.S. leads in Bitcoin price surge as Asia sees decline appeared first on CryptoSlate.