

Add ZyCrypto News On Google
Shiba Inu (SHIB) traded largely sideways on Tuesday following a volatile week marked by intense selling pressure across the broader cryptocurrency market.
Over the past seven days, the second-largest meme coin has fallen nearly 4%, remaining stuck within a narrow range since mid-May as investor sentiment stayed cautious.
However, despite signs of weakness across major digital assets, fresh on-chain activity involving massive SHIB withdrawals from exchanges has sparked renewed discussion about whale positioning and the meme coin’s longer-term outlook.
According to data shared by analytics platform CryptoQuant, nearly 490 billion SHIB tokens were withdrawn from centralized exchanges on May 24, potentially easing immediate selling pressure in the open market.
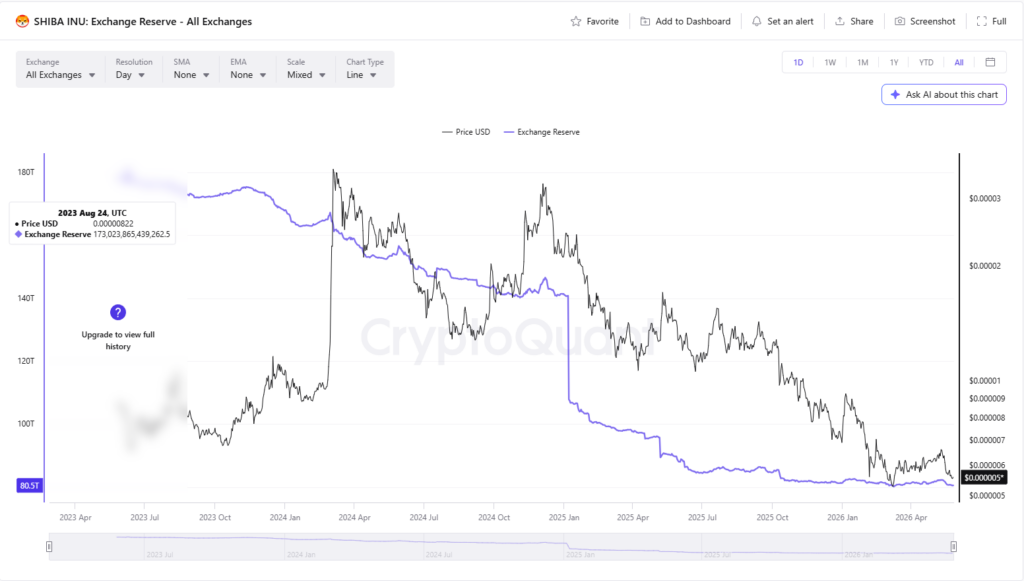
Notably, large SHIB withdrawals from exchanges are often viewed as a sign that investors may be shifting toward long-term holding rather than immediate selling. The trend has fueled speculation that whales could be accumulating during the current market downturn, while declining exchange reserves may help reduce short-term sell pressure.

 
Meanwhile, as per Coinglass data, SHIB futures flows dropped 3131% over the past 24 hours, with outflows exceeding inflows by $530,000, suggesting traders are reducing leverage or moving funds into cold storage.
However, SHIB’s burn rate has fallen by nearly 90% in recent weeks, raising concerns about whether the token’s supply-reduction narrative can continue to support bullish price expectations.
Meanwhile, TradingView analyst “Aurex-finance-excosystem” noted that SHIB’s weekly chart is forming a large contracting descending triangle, with converging trendlines indicating continued consolidation. Within this structure, the analyst identified a completed Elliott Wave zigzag correction, assigning a 68% bullish confidence level after the final downward leg, which completed the pattern near the triangle’s lower boundary.
“The corrective zigzag appears to have reached completion at a strong Higher Timeframe (HTF) support zone. This confluence increases the probability of bullish trend resumption and a potential breakout from the descending triangle,” the analyst stated.
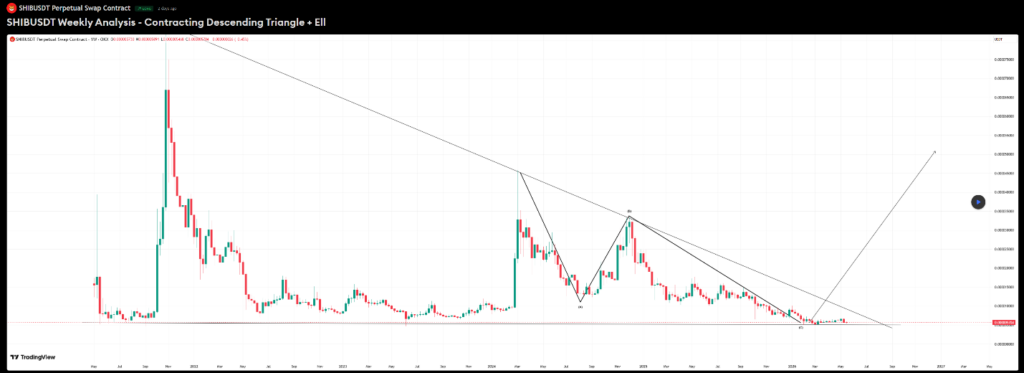
However, he added that signals on the 3-month timeframe remain unclear, resulting in conflicting multi-timeframe alignment.
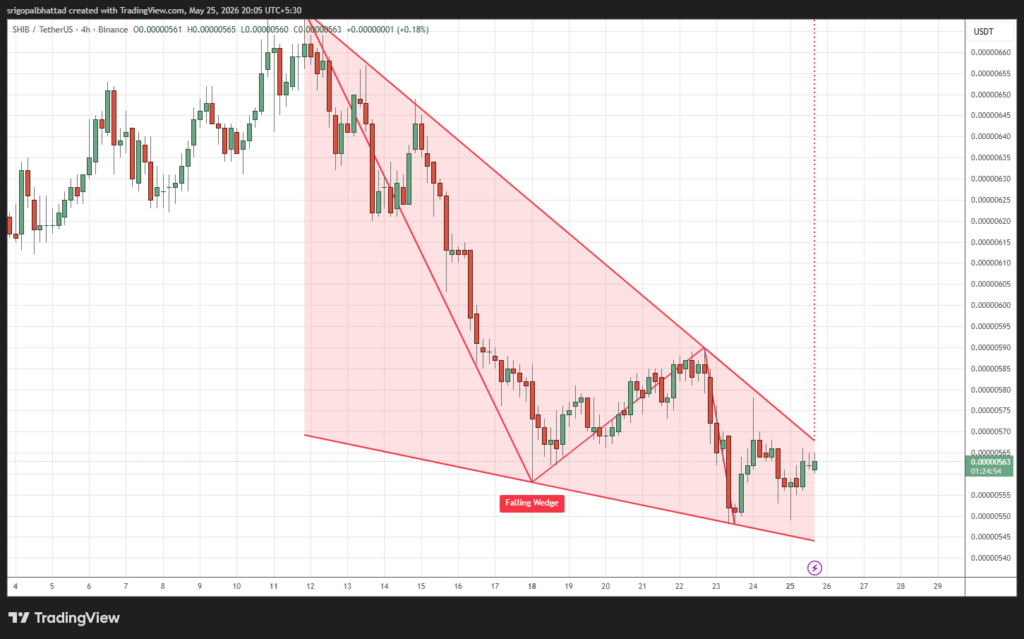
Furthermore, analyst “Crypto With Gopal” pointed to a broad falling wedge pattern forming on SHIB’s chart, a structure that traders often associate with potential bullish reversals. According to the analyst, the token has repeatedly defended a lower support zone despite sustained selling pressure over recent weeks.
The repeated support retests suggest that buyers may gradually be stepping back into the market as downside momentum weakens. Price compression near wedge resistance has also increased speculation that SHIB could experience a stronger move if breakout volume emerges.
At press time, SHIB was trading at $0.000005609, reflecting a 1.25% drop in the past 24 hours.