Ripple’s recent price movement has been marked by extreme volatility, particularly following a breakout above the upper trendline of a sideways triangle pattern, reaching the critical resistance level of $0.66. This indicates a significant struggle between buyers and sellers, which will greatly influence Ripple’s future trajectory.
By Shayan
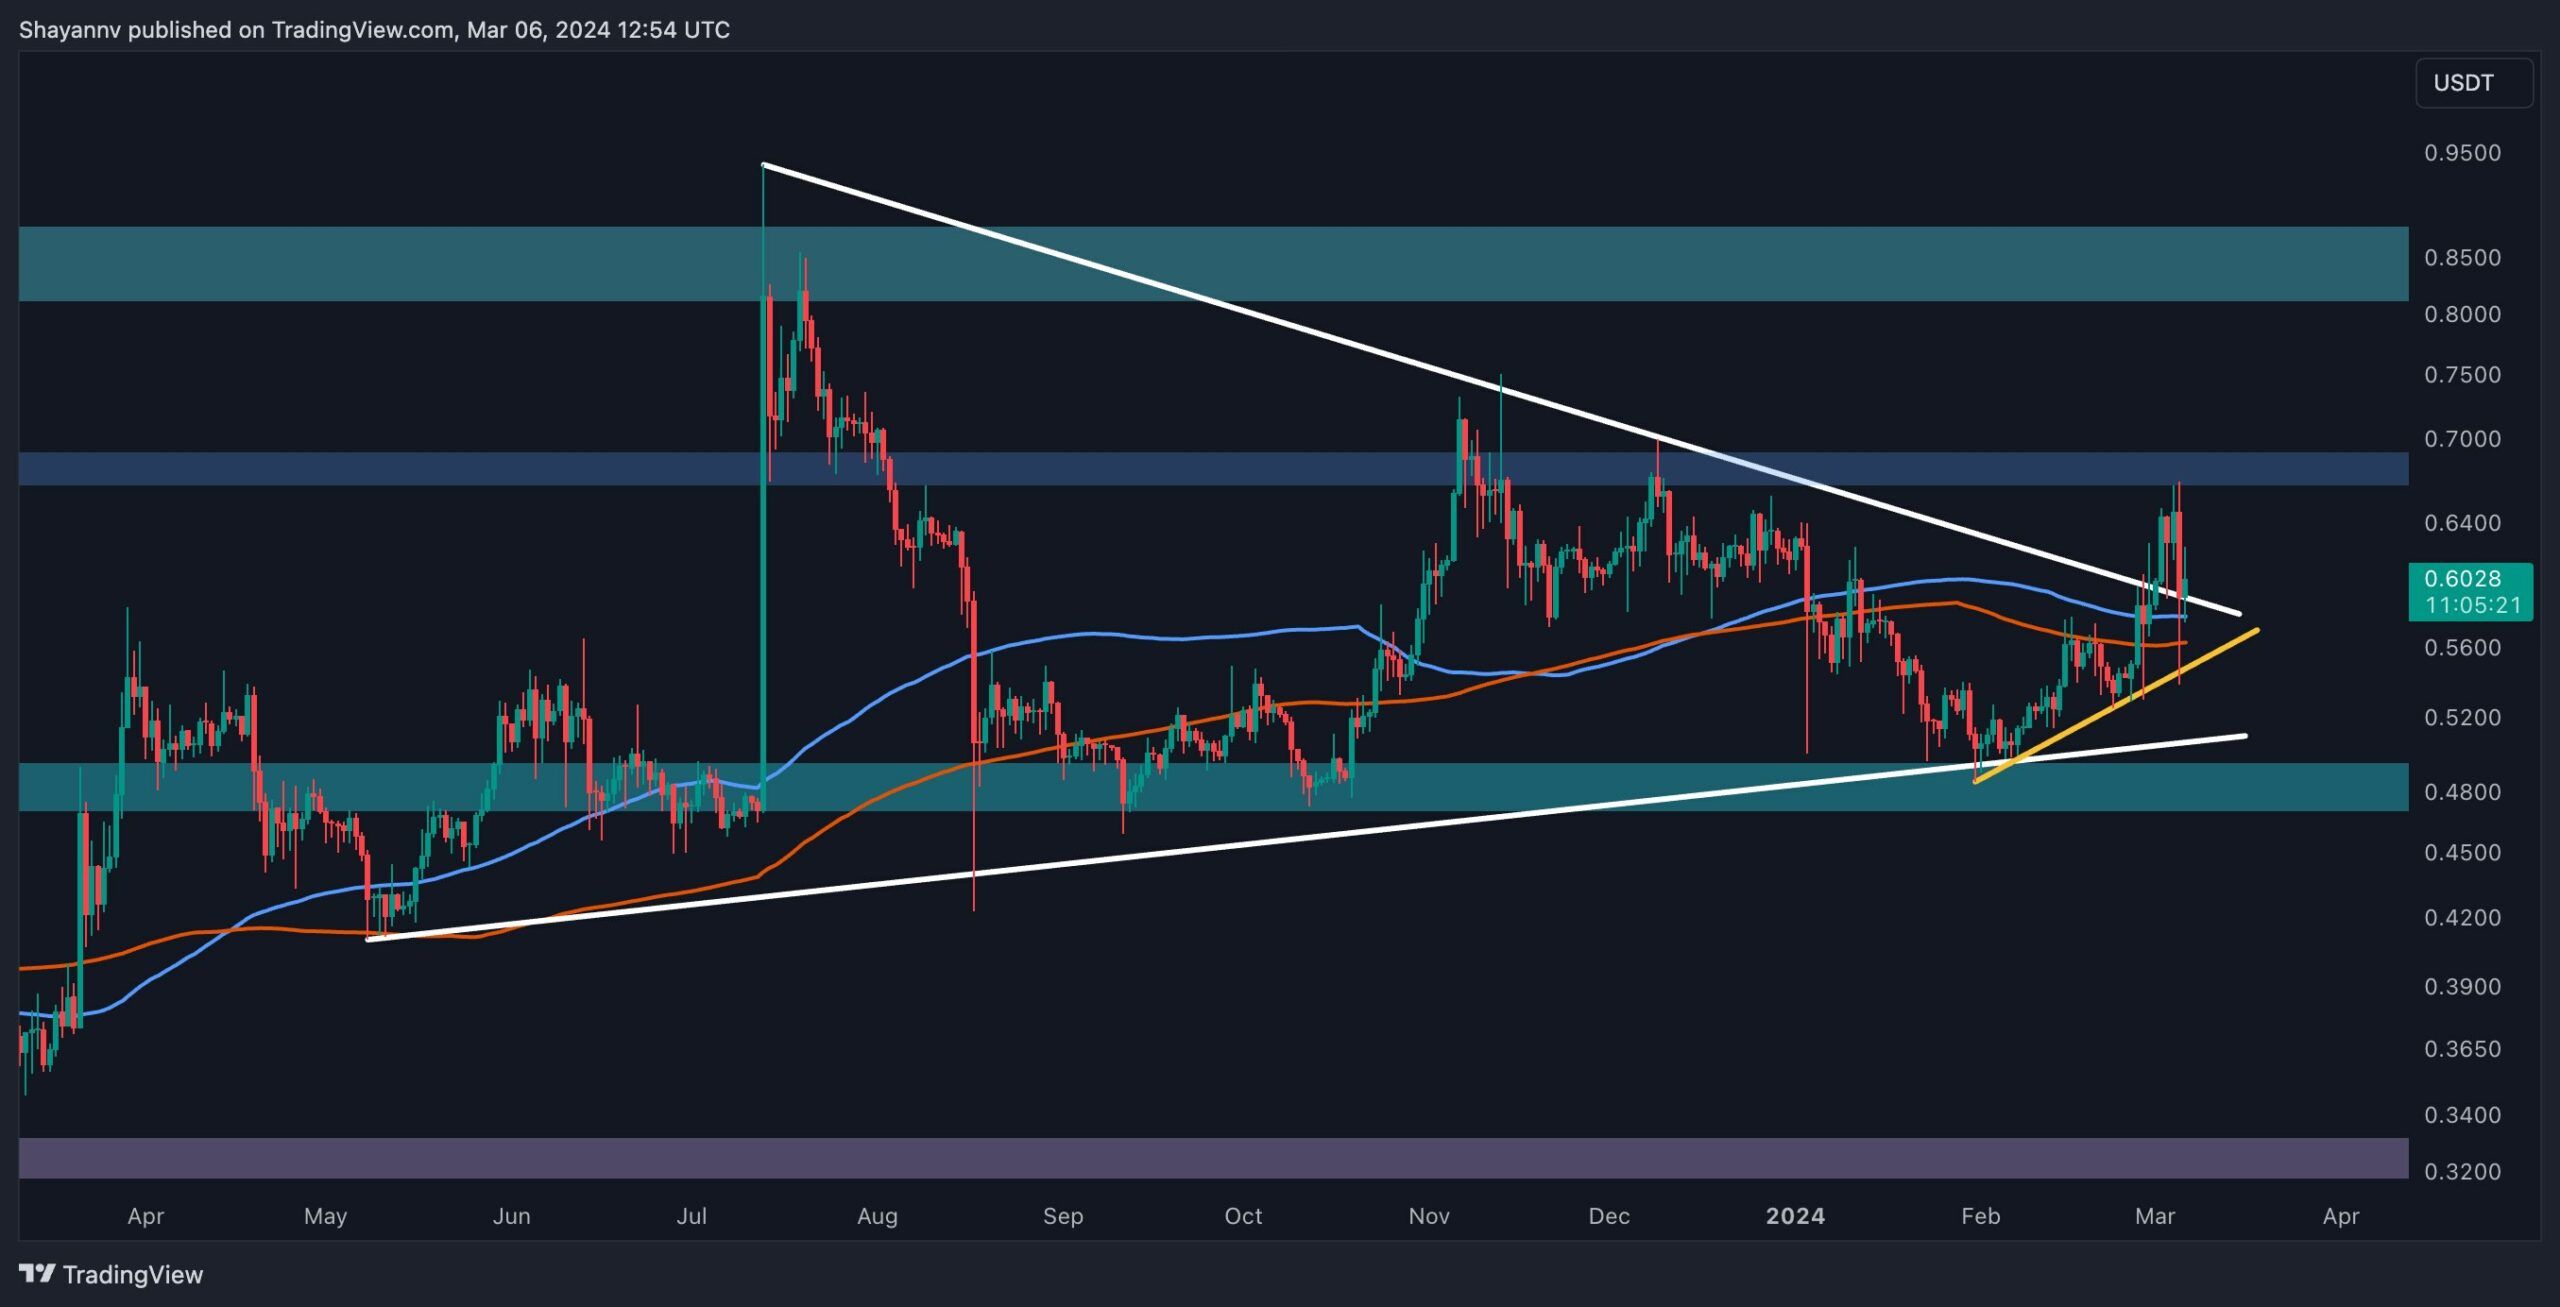
The Daily Chart
Upon examination of the daily chart, Ripple’s price surge is evident as it breached a crucial resistance area represented by the dynamic upper boundary of the triangle pattern. Subsequently, the price extended its upward movement towards the significant resistance level of $0.66, raising expectations for a potential breakout.
However, upon reaching the decisive $0.66 region, increased selling pressure emerged, resulting in a notable rejection that pushed the price back within the confines of the broken triangle. This led to heightened volatility around the significant support region of the 100-day moving average, with notable fluctuations occurring around this critical threshold.
Despite these challenges, the prevailing market sentiment and optimistic outlook within the cryptocurrency industry suggest an expectation for Ripple’s price to initiate a spike, aiming to breach the critical resistance of $0.66. This could potentially trigger a strong bullish rally targeting the significant $0.8 resistance level.
The 4-Hour Chart
A closer analysis of the 4-hour chart reveals a notable price spike following a consolidation phase around the $0.53 level, reaching a crucial resistance region near $0.66.
However, the presence of significant supply in this resistance zone led to a notable rejection, resulting in a 19% decline towards the lower trendline of the triangle.
Despite this setback, XRP found support at this crucial level, prompting a fresh price surge that once again breached the upper boundary of the triangle. However, XRP’s price is likely to be confined within the dynamic 100-day moving average and the notable $0.66 resistance level, suggesting the potential for prolonged consolidation within this pivotal range until a breakout occurs.
A breach above the $0.66 threshold would shift attention toward the $0.8 resistance level as the next focal point for Ripple’s price trajectory.

Binance Free $100 (Exclusive): Use this link to register and receive $100 free and 10% off fees on Binance Futures first month (terms).
Disclaimer: Information found on CryptoPotato is those of writers quoted. It does not represent the opinions of CryptoPotato on whether to buy, sell, or hold any investments. You are advised to conduct your own research before making any investment decisions. Use provided information at your own risk. See Disclaimer for more information.
Cryptocurrency charts by TradingView.