 Price Hold or Fold at alt=")
The price of Cardano (ADA) is trading inside a crucial horizontal support area at $0.25. The area has been in place since the start of the year.
Readings from the weekly and daily timeframes are mixed, making it difficult to determine the future trend’s direction until the price makes a decisive movement in one or the other direction.
Cardano Price Hovers Above Support
The technical analysis from the weekly timeframe shows that ADA is hovering just above the $0.25 horizontal support area. This is an important support area that has been in place since the start of the year.
The price action inside the area gives conflicting signs. On the bullish side, ADA has seemingly created a triple bottom pattern (green icons). The triple bottom is considered a bullish pattern and is expected to move significantly upward.
On the bearish side, the price has fallen under a descending resistance line since the beginning of May. More recently, the line rejected the price in July (red icon), creating a long upper wick. When combined with the $0.25 area, this creates a descending triangle, considered a bearish pattern.
Crypto investing, simplified. Get ADA price predictions here.
Moreover, the weekly RSI is also undetermined. Traders utilize the RSI as a momentum indicator to assess whether a market is overbought or oversold, and to determine whether to accumulate or sell an asset.
If the RSI reading is above 50 and the trend is upward, bulls still have an advantage, but if the reading is below 50, the opposite is true. While the RSI has generated bullish divergence, its trendline (green line) is at risk of breaking down. Moreover, it is below 50, a sign of a bearish trend.
Therefore, whether the price breaks out from the resistance line or breaks down below the $0.25 area can determine the future trend’s direction.
A breakout can cause a 60% increase to the $0.42 resistance area, while a breakdown could initiate a 40% drop to the next closest support at $0.15.
Check Out the Best Upcoming Airdrops in 2023
ADA Price Prediction: Will Bulls or Bears Win the Battle?
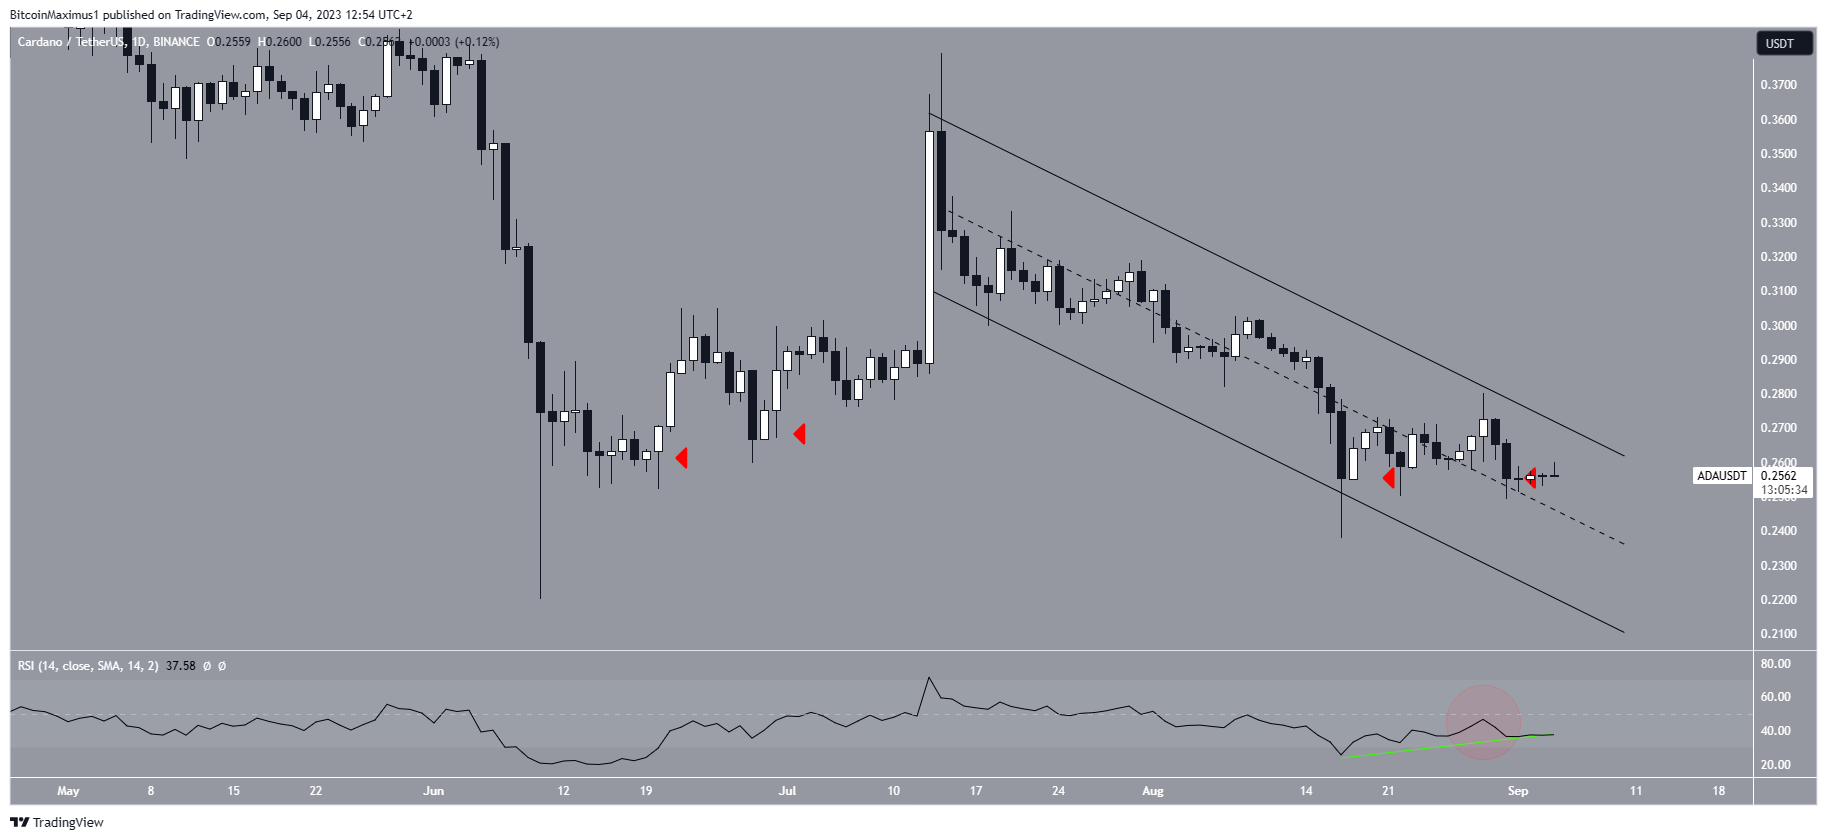
The daily timeframe analysis gives a mixed perspective. This is because of both the price action and the RSI readings.
The bearish portion of the price action comes from the progressive lower closes since June (red icons). This is a sign that bulls are losing momentum, causing the price to close lower each time gradually. The bullish portion comes from the presence of a descending parallel channel.
These channels often contain corrective movements, meaning that an eventual breakout from it is expected.
Trade With AI – 9 Best AI Crypto Trading Bots to Maximize Your Profits
The daily RSI also provides mixed signals. On one hand, the indicator is below 50 and decreasing (red circle). On the other, it has generated a bullish divergence. These mixed signs make it difficult to determine the trend’s direction.
To conclude, the ADA price prediction will determine whether the price breaks out from the long-term resistance line or down from the $0.25 area instead.
A breakout can lead to a 60% increase, while a breakdown could cause a 40% fall.
For BeInCrypto’s latest crypto market analysis, click here.
The post Will Cardano (ADA) Price Hold or Fold at $0.25? appeared first on BeInCrypto.