The data of two on-chain indicators may be referred to for finding out whether the latest Ethereum rally can go on or not.
Ethereum Has Enjoyed A Sharp Rally Of More Than 12% In The Past Week
Like the rest of the cryptocurrency market, Ethereum has observed a rally during the past few days. Although the coin’s bullish momentum hasn’t been quite as strong as Bitcoin’s, its weekly gains of 12% are still nonetheless significant.
Yesterday, the asset had been carrying even higher profits, as its price had touched above $1,850. In the past day, though, ETH has noted some drawdown, as it’s now trading under the $1,800 level.
ETH has registered some sharp growth in recent days | Source: ETHUSD on TradingView
After the pullback, some investors have been wondering whether the Ethereum rally is done for now or if it has hopes for continuing further. On-chain data from Santiment may hold some hints about that.
ETH Exchange Supply Has Plunged, While Whale Transfers Have Spiked
In a new post on X, the on-chain analytics firm Santiment has discussed two important ETH metrics. The first of these is the “whale transaction count,” which keeps track of the total number of Ethereum transactions that carry a value of at least $100,000.
Generally, only the whale entities are capable of moving such a large amount of the asset with a single transfer, so transactions of this scale are assumed to reflect the behavior of these humongous investors.
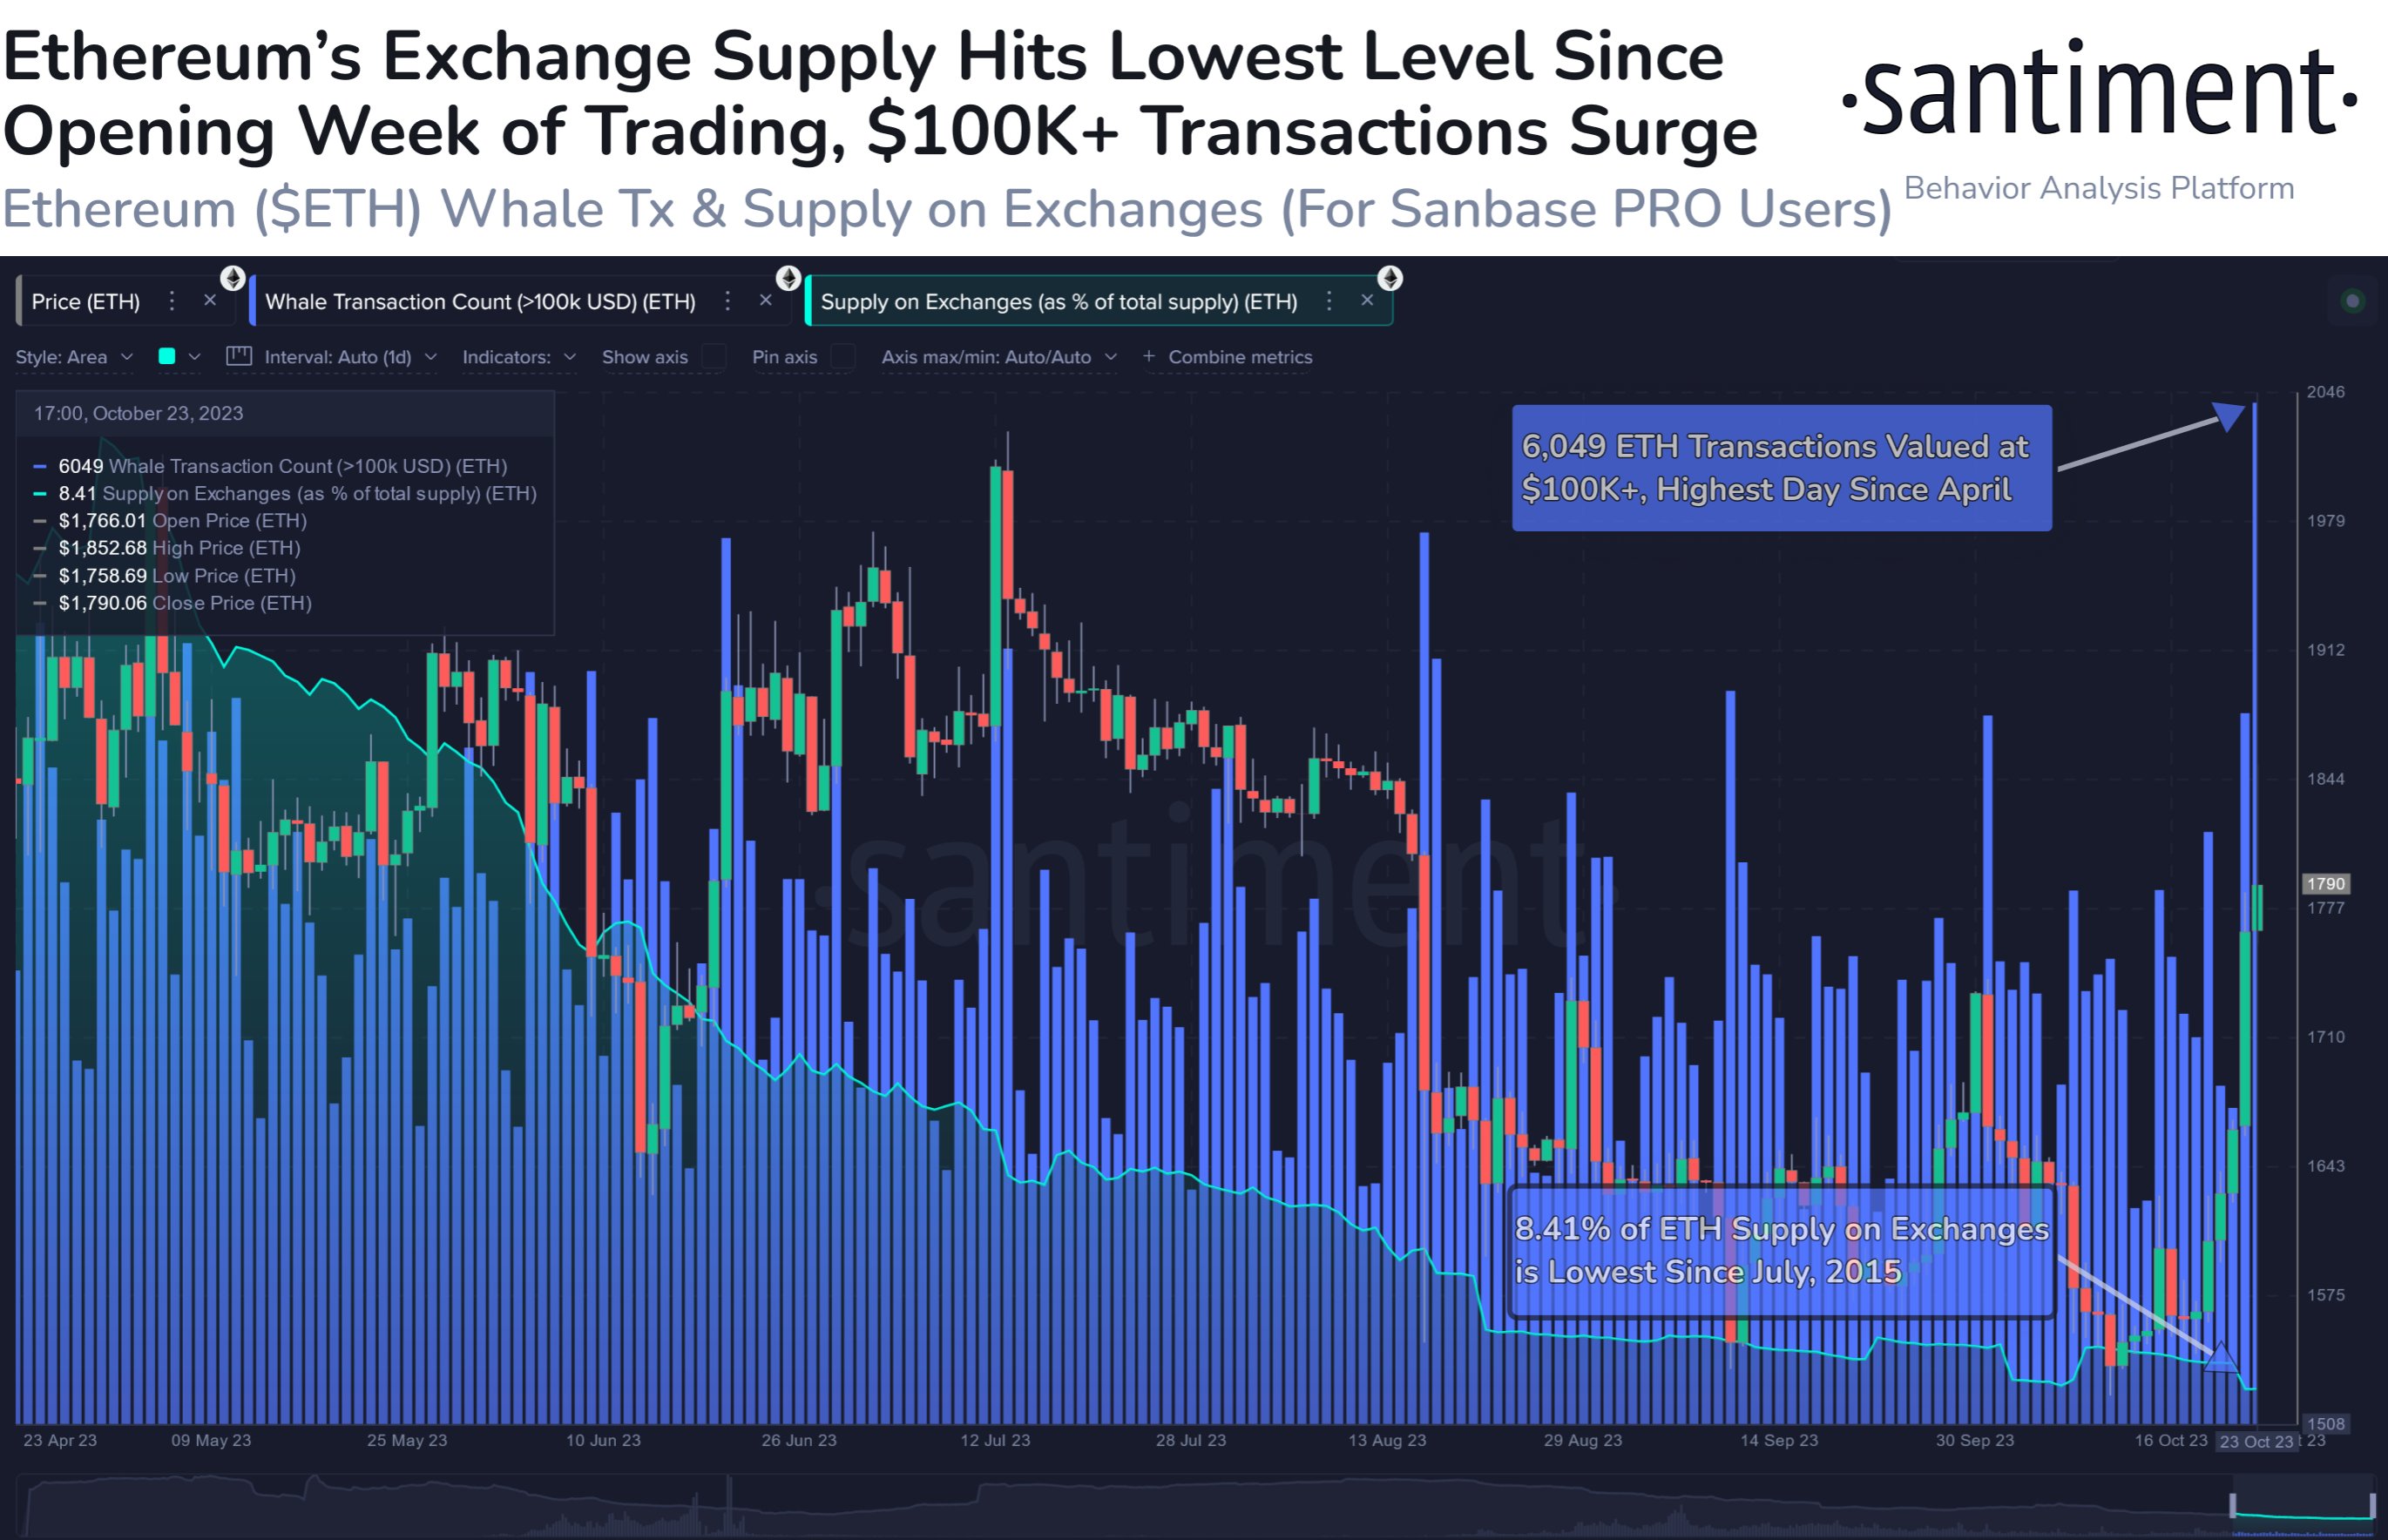
The below chart shows the trend in this ETH indicator over the past few months.
Looks like the value of the metric has been quite high in recent days | Source: Santiment on X
As displayed in the above graph, the Ethereum whale transaction count has observed some pretty high values recently. This suggests that these large holders have been quite active in the market.
At the peak of this spike, the indicator had a value of 6,049, which is the highest number of daily transactions that the whales have made on the network since April of this year.
The whale transaction count metric by itself can’t point towards a bullish or bearish outcome for the cryptocurrency, as both selling and buying transfers are included in the count.
It’s true, however, that whales would need to stay active if the rally has to continue, as their contribution will provide the necessary fuel for it. So far, the whales have been active indeed, but it remains to be seen whether they are still buying or if they are pivoting towards selling. The pullback in the Ethereum price may hint towards the latter.
The other indicator that Santiment has attached to the chart is the “supply on exchanges,” which measures the percentage of the total circulating ETH supply that’s sitting in the wallets of all centralized exchanges.
From the graph, it’s visible that this indicator has only continued to slide down since the rally started, implying that investors have continued to make net withdrawals from these platforms.
At present, 8.41% of the ETH supply is on exchanges, which is the lowest level since July 2015. Holders continuing to withdraw their coins can be a constructive sign for the cryptocurrency, as it can be a sign that accumulation is going on.
Featured image from Bastian Riccardi on Unsplash.com, charts from TradingView.com, Santiment.net

