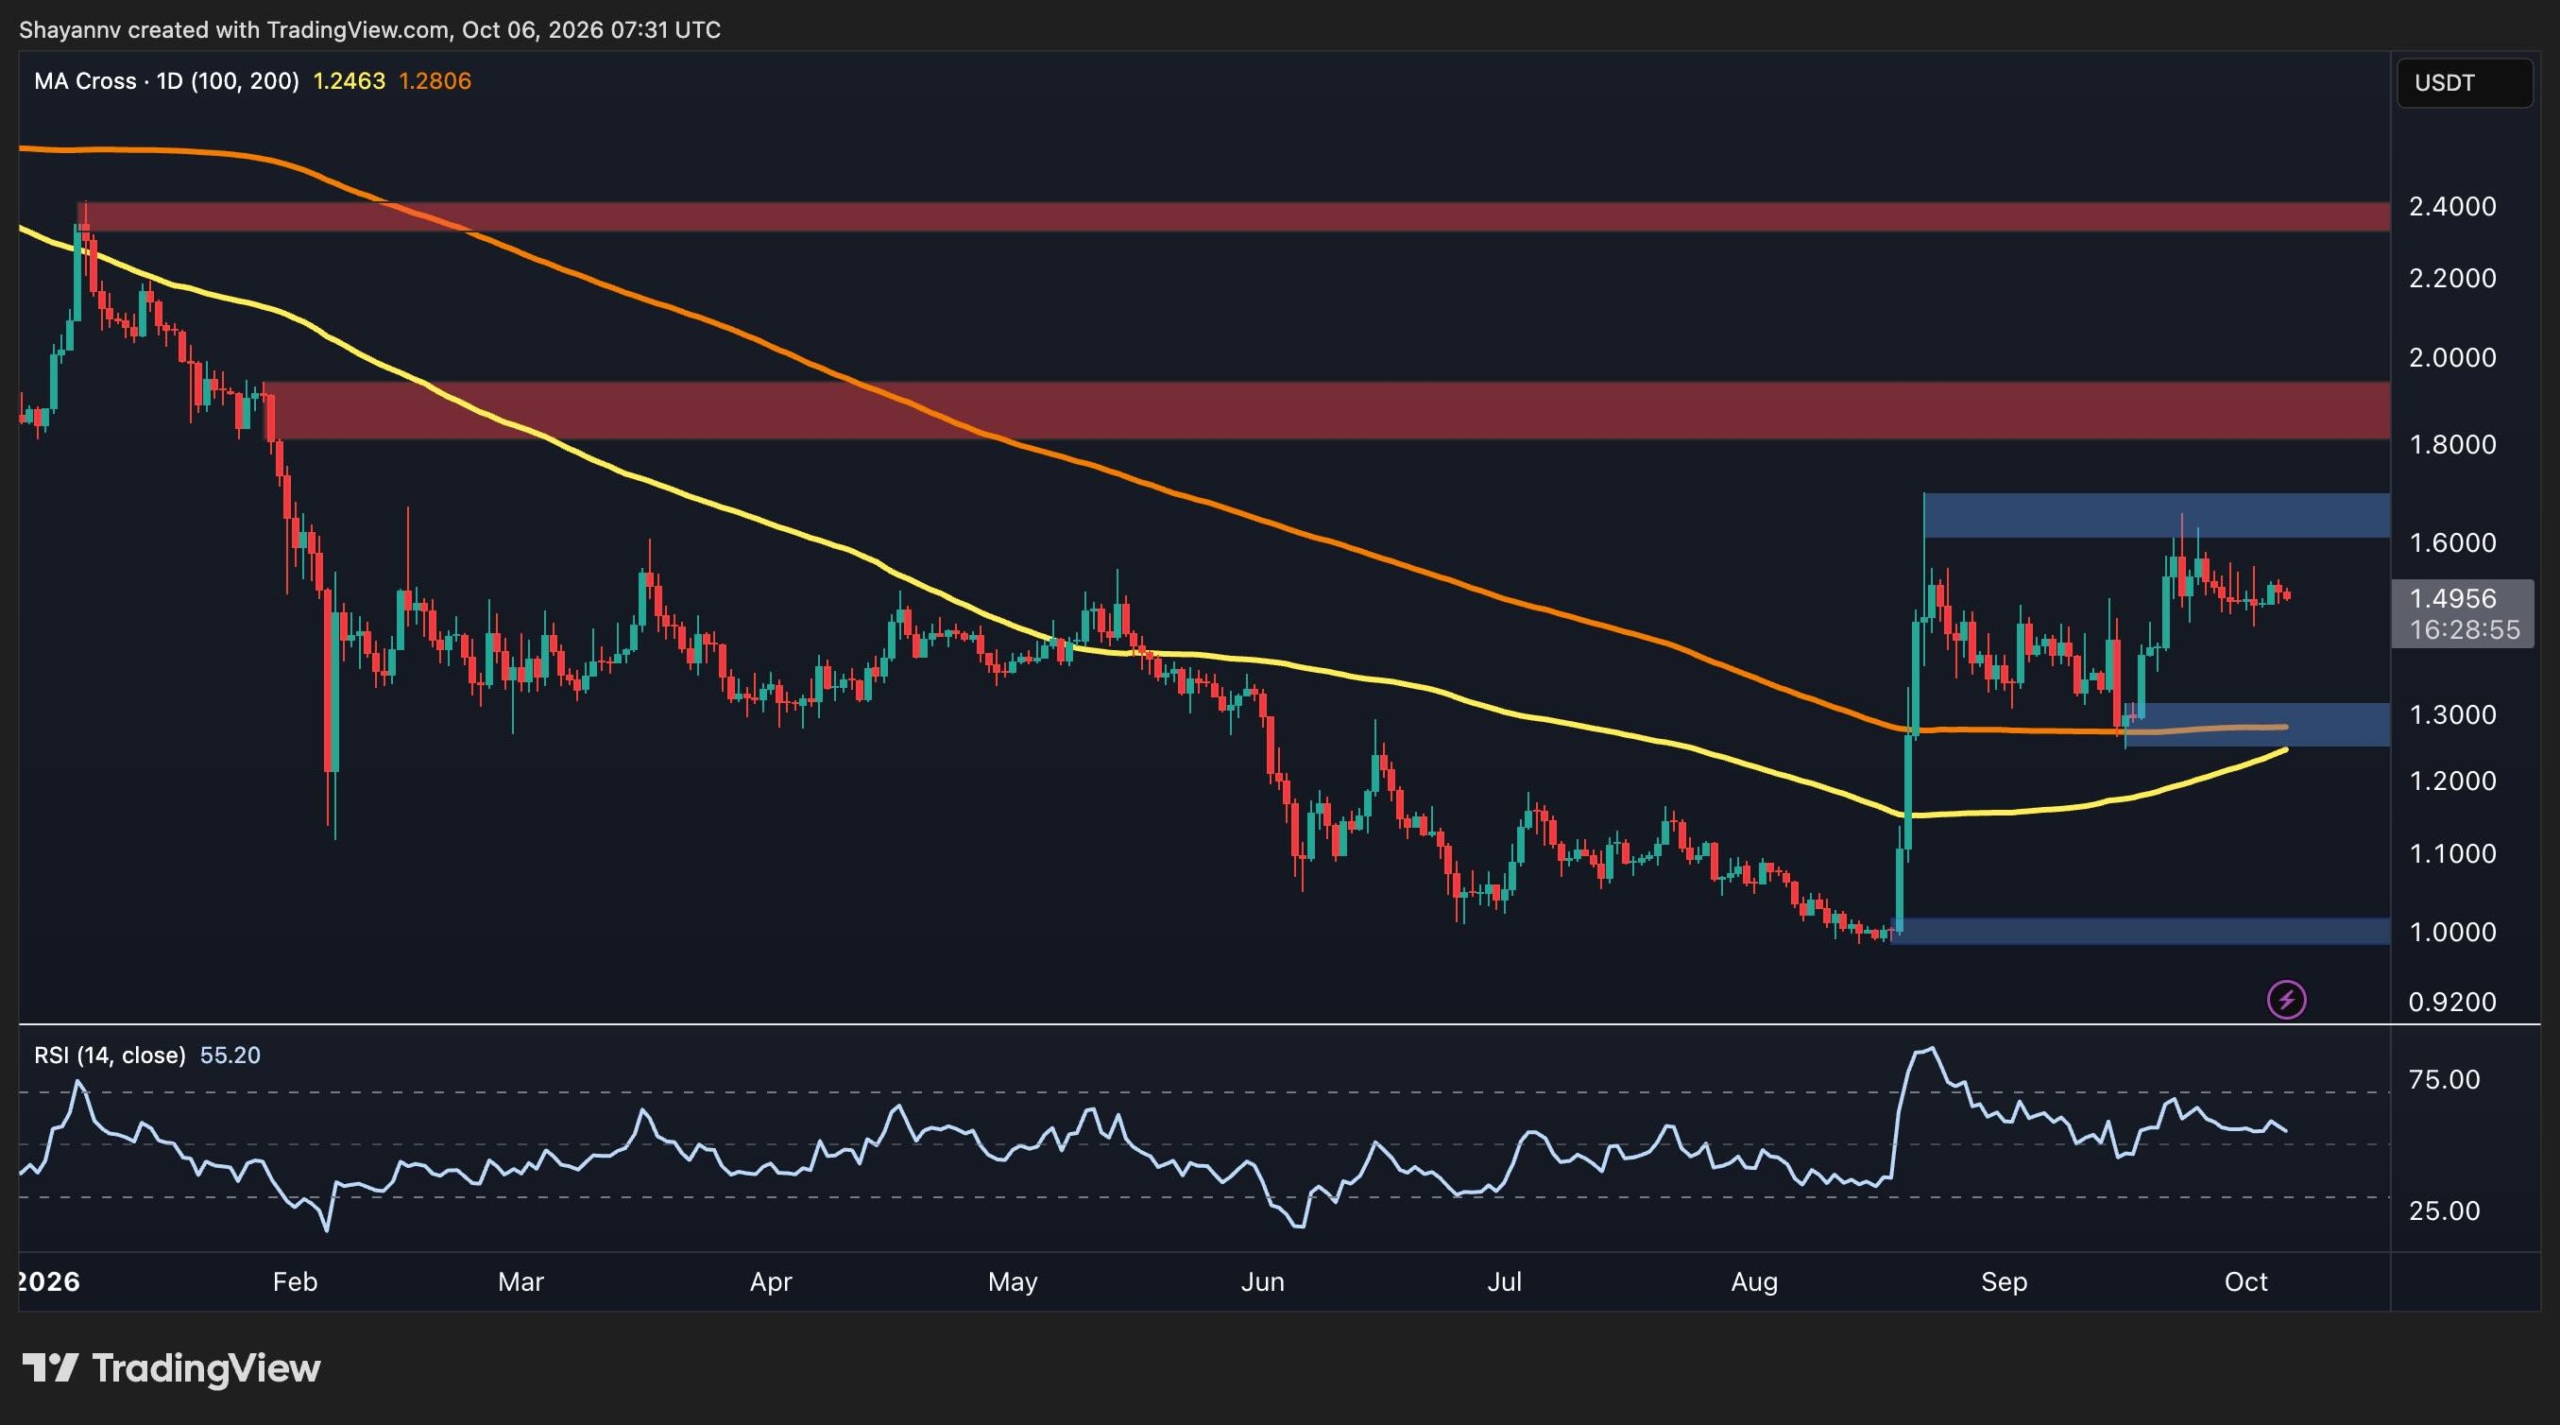
XRP is consolidating near $1.50 following a significant rebound from the $1.00 support zone. The asset's structural position has improved, though recent price action indicates buyers face resistance in pushing higher.
Daily Chart Structure
The daily timeframe shows a major recovery that began from the $1.00 support level. XRP broke higher in August and reclaimed both the 100-day and 200-day moving averages, which currently sit around $1.25 and $1.28 respectively. The two averages are approaching a potential bullish crossover.
The primary resistance zone spans $1.60 to $1.70. XRP has tested this area twice in recent weeks, with a September attempt failing to establish a breakout. A daily close above $1.70 would signal structural improvement and could target the next major resistance near $2.00. Further resistance exists around $2.40, coinciding with an early-year high.
Critical support has formed in the $1.25-$1.30 region, which contains both moving averages and a marked demand zone. Maintaining this support level preserves the broader recovery structure. A decisive break below this area could send XRP back toward $1.00, reversing recent gains.
Short-Term Consolidation Pattern
The 4-hour chart reveals XRP trading within a tightening range beneath a descending trendline. This trendline acts as dynamic resistance, with XRP repeatedly failing to sustain moves above it. Simultaneously, buyers have defended the $1.45 support zone, creating a well-defined consolidation band.
A breakout above the trendline and through $1.70 would strengthen the bullish case and bring $2.00 into focus. A loss of the $1.45 support would weaken the short-term structure, potentially allowing a retest of the $1.30 demand zone. Further weakness could extend toward $1.00 and potentially lower.
The current pattern is characterized as consolidation rather than a bearish reversal, with a higher probability favoring a bullish breakout.