
The XRP price recently encountered resistance at the golden ratio level of around $0.65, experiencing a bearish rejection at this crucial Fibonacci resistance.
This rejection signals a challenging period ahead for Ripple’s price trajectory.
XRP Price Downtrend?
A few days ago, the XRP price approached the crucial golden ratio resistance at $0.65, but it faced a bearish rejection after several unsuccessful attempts to break through. Consequently, XRP retreated to find support near the golden ratio at $0.55, from which it saw a bullish rebound.
Notably, a golden crossover has emerged in the daily chart, signaling a bullish trend in the short to medium term.
However, the moving average convergence/divergence (MACD) histogram has been declining bearishly since yesterday, despite the MACD lines maintaining a bullish crossover while the Relative Strength Index (RSI) remains neutral.
XRP’s 4H Chart: Golden Crossover
A golden crossover has occurred in XRP’s 4H chart, affirming a short-term bullish trend, although the MACD lines remain bearishly crossed. Despite this, the RSI is neutral, and the MACD histogram shows bullish momentum.
However, XRP faces resistance at the 50-4H-EMA around $0.608, hindering its progress.
Read More: Ripple XRP Price Prediction 2024/2025/2030
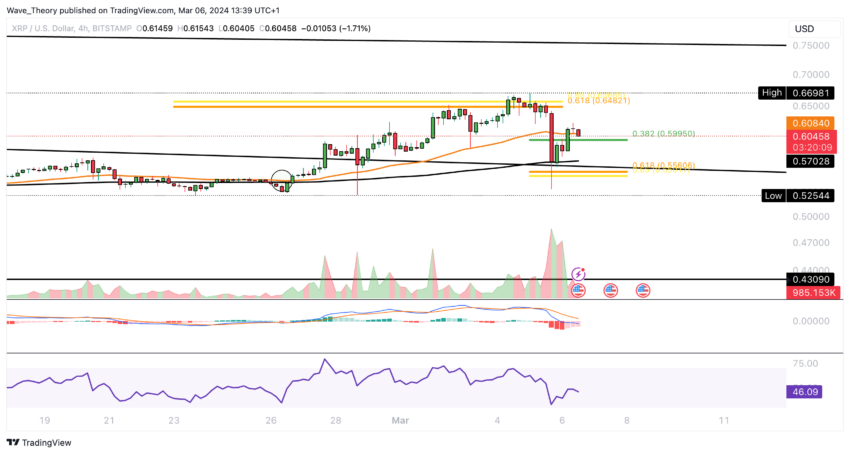
As a result, XRP may retreat to find support near the golden ratio at $0.55 unless it successfully clears the golden ratio resistance at $0.65 to end the correction.
Ripple’s Weekly Chart: Bullish Indicators
In XRP’s weekly chart, a golden crossover signals a bullish trend for the medium term, supported by an upward trend in the MACD histogram. Although the MACD lines are on the verge of a bullish crossover, the RSI remains neutral.
Breaking the Golden Ratio resistance at $0.65 could lead XRP towards significant Fibonacci resistance at $0.75, with further resistance at $0.923.
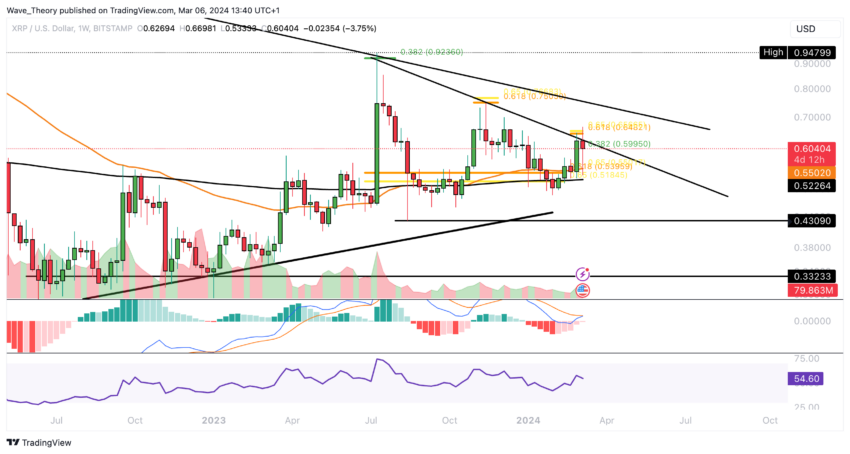
Conversely, if XRP retreats, it may find support near the golden ratio at $0.54, where the 50-week EMA also lies.
Ripple’s Monthly Chart: MACD Shows Bullish Trend
In the monthly chart, XRP indicators lean towards bullishness with a neutral RSI and bullish crossover in the MACD lines, accompanied by an uptrend in the MACD histogram.
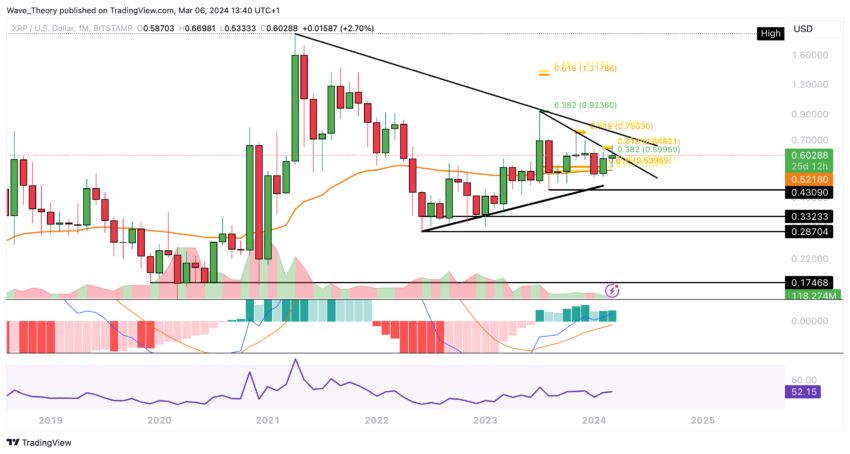
This upward movement has persisted for months, but XRP has yet to witness a definitive bullish trend reversal. Breaking the golden ratio resistance at approximately $1.35 is crucial to achieve this.
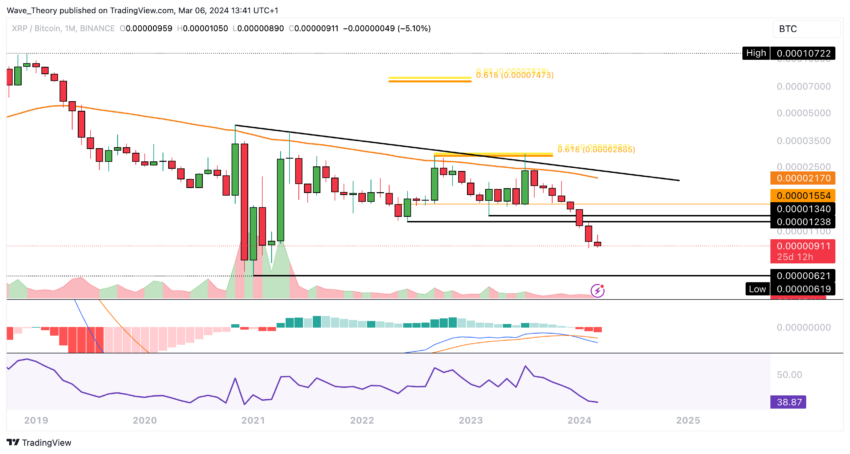
XRP Price Remains Bearish Against Bitcoin
Ripple’s price is experiencing a notable downtrend against BTC, with the next significant support level for XRP price estimated at around 0.0000062 BTC.
Read More: How To Buy XRP and Everything You Need To Know
Moreover, in the monthly chart, bearish signals are evident as the MACD lines have crossed negatively, and the MACD histogram displays a growing bearish inclination while the RSI remains in neutral territory.
The post XRP Faces Crucial Resistance at $0.65 – Here’s Why appeared first on BeInCrypto.