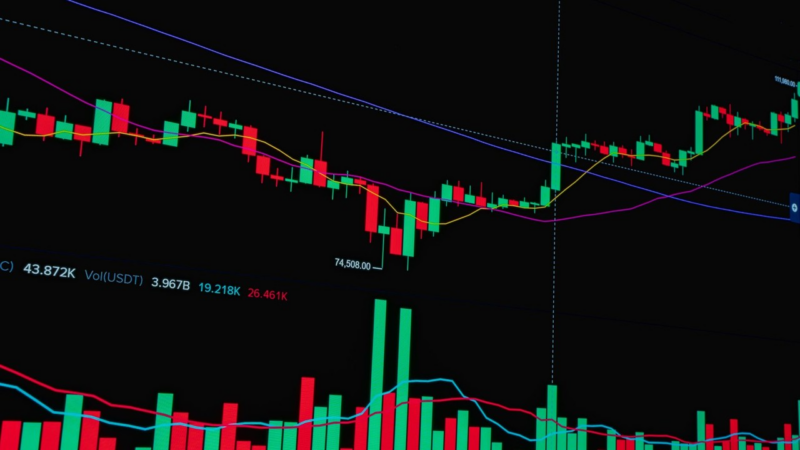
XRP is trading near critical support levels as analysts point to a potential decline toward $1.00, citing technical patterns and liquidity zones on daily charts.
Analyst 360Trader identified a fair value gap extending from approximately $1.00 to $1.25 as a key area likely to attract price action. He highlighted $1.248 as a threshold level that, if broken, could expose XRP to further downside toward the $1.00 level. At current trading levels near $1.28, XRP's ability to hold above $1.248 remains critical to preventing a deeper decline.
Technical indicators show additional resistance points for potential recovery. A volume profile on the daily chart shows concentrated trading activity around $1.35–$1.55, marking a key resistance zone. Above that, another fair value gap exists around $1.40–$1.48.
The broader technical picture suggests headwinds. XRP has fallen below both its 50-day and 200-day moving averages, with the 200-day moving average now near $1.28. On a weekly basis, XRP trades below its 50-week and 200-week exponential moving averages at $1.56 and $1.37, respectively.
Vandell Aljarrah, co-founder of Black Swan Capitalist, acknowledged the possibility of further price declines in the near term. He noted that XRP's weekly chart shows it below key moving averages, increasing the risk of additional downside. However, Aljarrah maintains that the long-term outlook remains bullish, pointing to historical patterns where prolonged consolidation has preceded major rallies.