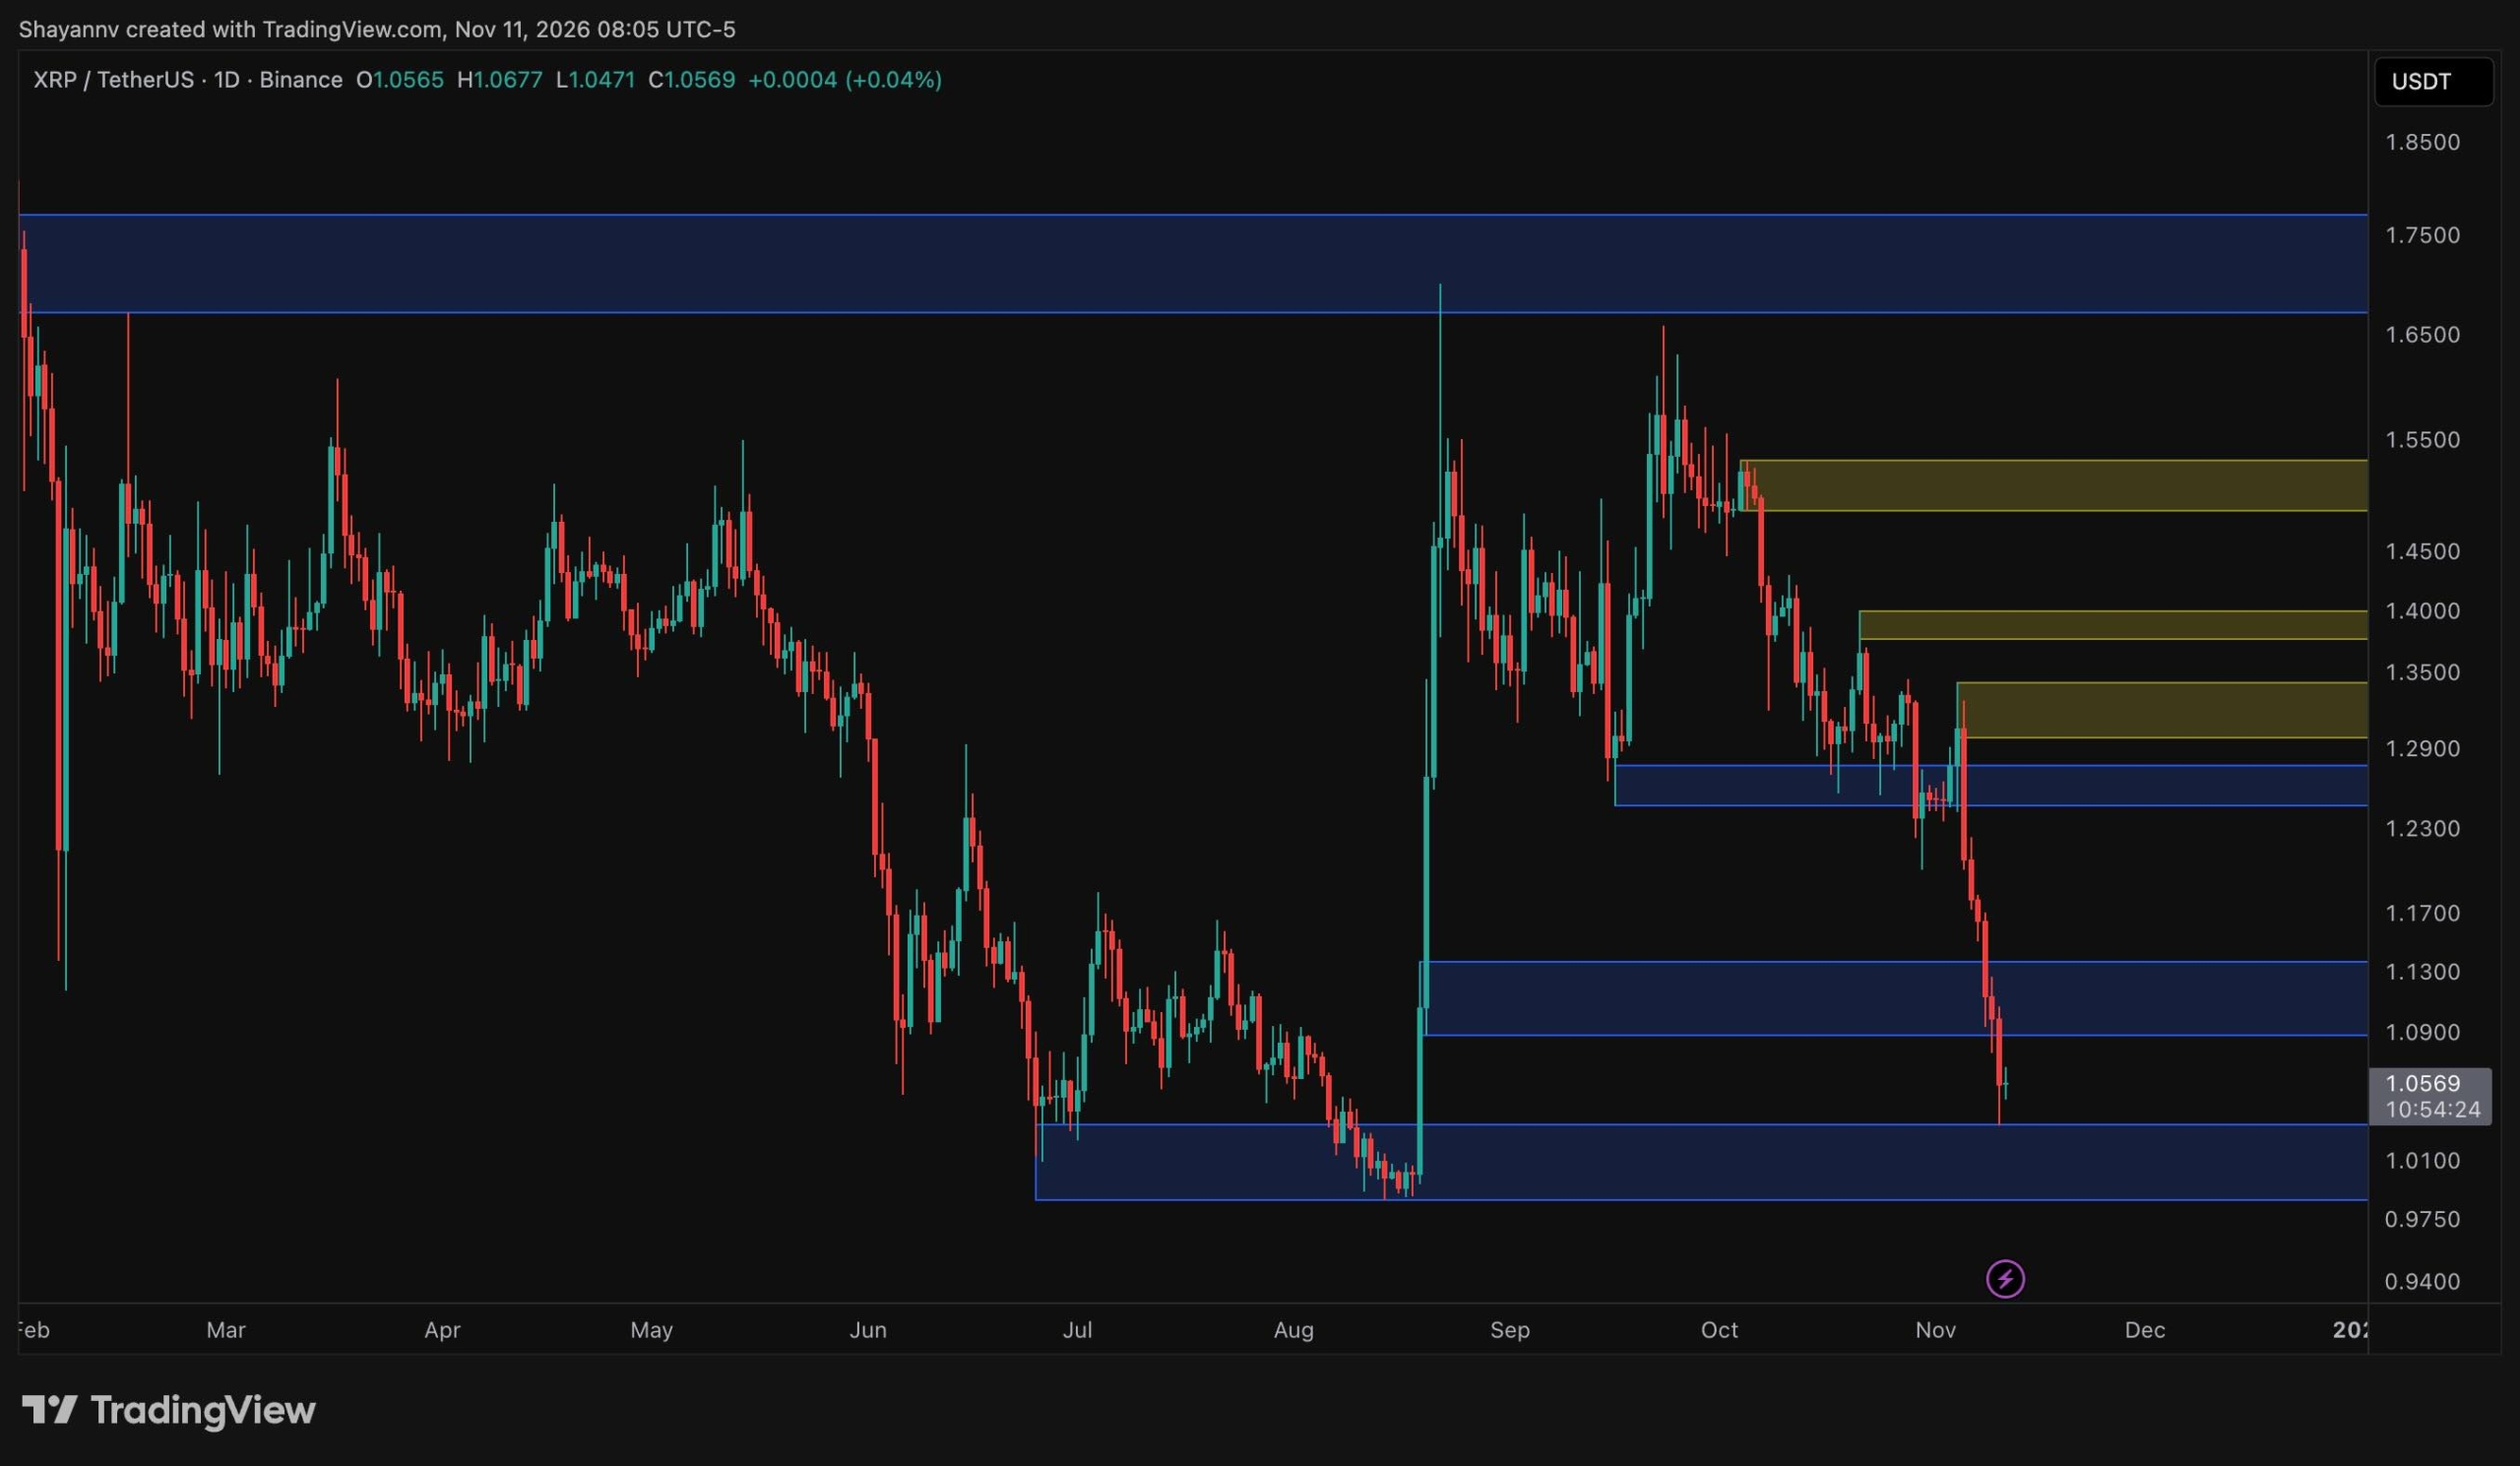
XRP has continued its decline after a failed breakout attempt in early November, slipping below $1.10 and now trading around $1.06. The asset is approaching the $1.00 demand zone that served as the base of the sharp August rally, making the coming sessions crucial to whether buyers can halt the sell‑off before a deeper breakdown.
Daily chart outlook
The daily chart shows a deepening bearish structure. After the August surge from the $1.00 region toward $1.70 failed to hold, XRP formed a lower high near $1.65 in late September. It has since lost both the $1.25 support and the $1.10 zone that marked the breakout point of the August rally.
Price is now hovering just above the $1.00 demand zone, where XRP consolidated through July and early August. A lower wick toward approximately $1.03 suggests some buyer response, but no meaningful rebound has formed. A decisive daily close below $1.00 would leave little marked support beneath it and raise the risk of an extended move lower.
On the upside, XRP would first need to reclaim $1.10, which could now act as resistance. Beyond that, the $1.25 level and the $1.30 supply zone, where the early‑November rally was rejected, remain the main obstacles to recovery.
4‑hour chart dynamics
On the 4‑hour timeframe, XRP has been trading within a descending channel since late September. Early November brought a brief breakout above the upper trendline toward $1.33, but the move was quickly rejected inside the $1.30 supply zone, trapping late buyers and preceding an aggressive sell‑off.
The decline sliced through the $1.25 support and the channel’s lower boundary near $1.11, indicating accelerated bearish momentum. The token dropped to approximately $1.03, the upper edge of the $1.00 demand zone, and is now consolidating around $1.05.
A relief bounce from this area could target the $1.10 zone, where the broken lower trendline may attract sellers on a retest. Conversely, a drop below $1.03 would likely expose the full demand zone toward $0.98, suggesting further downside risk.