The XRP price has recently encountered a bearish rejection once more at the critical golden ratio level, approximately valued at $0.75. Subsequently, the price of Ripple has entered a corrective phase.
The question arises: To what extent will the Ripple price decline? Is the corrective movement anticipated to be prolonged?
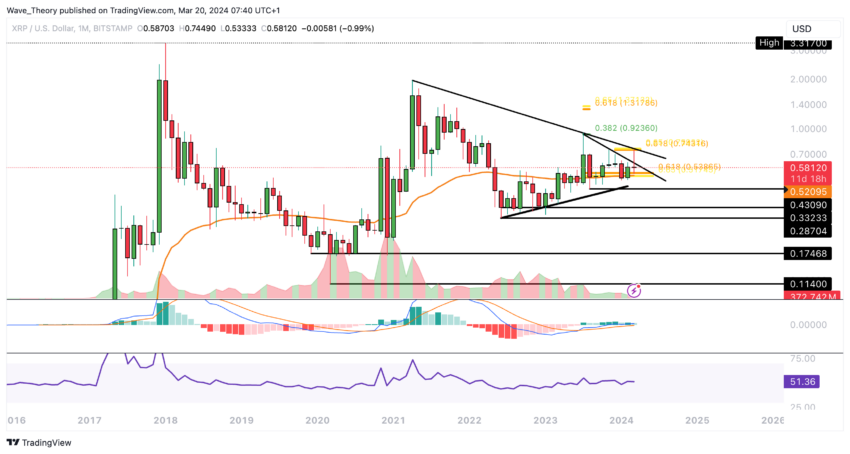
XRP Price Faces Clear Rejection at Golden Ratio Level
This month, the XRP price approached the critical golden ratio resistance level at approximately $0.75. However, it faced substantial rejection at this juncture.
Consequently, the histogram of the Moving Average Convergence Divergence (MACD) is displaying a bearish trend despite the MACD lines maintaining a bullish crossing. The Relative Strength Index (RSI) remains neutral.
Currently, XRP is encountering substantial Fibonacci support, situated around $0.52. Additionally, the 50-month Exponential Moving Average (EMA) provides supplementary support at this level.
Read More: How To Buy XRP and Everything You Need To Know
The integrity of the bullish momentum is contingent upon Ripple’s ability to sustain levels above this critical support.
Weekly Chart Analysis: XRP Price Sends Bearish Signals
In the weekly chart, bearish signals are emerging among the indicators. While a golden crossover persists, affirming a bullish medium-term trend, the MACD lines are on the brink of a bearish crossover. Furthermore, the MACD histogram displays a downward trend this week.
Meanwhile, the RSI remains neutral, offering no clear bullish or bearish indications. Nevertheless, Ripple has an opportunity to potentially rebound bullishly from the golden ratio support level around $0.52.
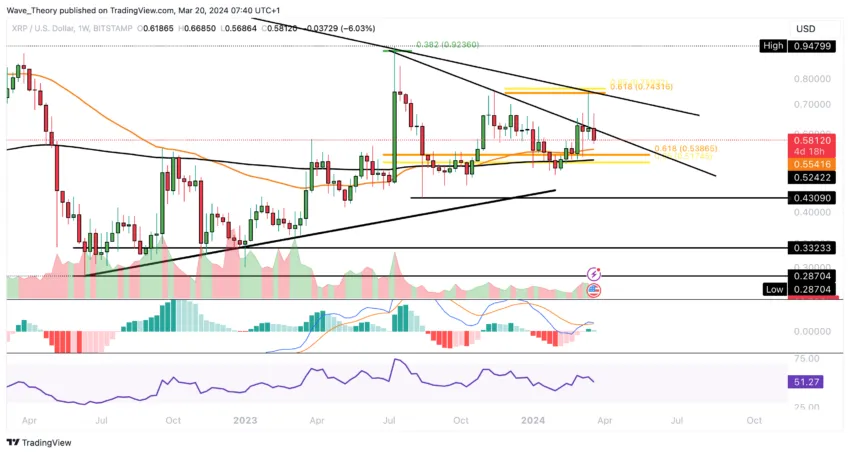
At this juncture, the 50-week and 200-week EMAs serve as supplementary supports.
Daily Chart Confirms Bullish Trend for XRP Price
In the daily chart, the bullish trend remains confirmed by the golden crossover of the EMAs. However, bearish indications arise as the MACD lines have crossed in a bearish manner, with the MACD histogram trending downwards.
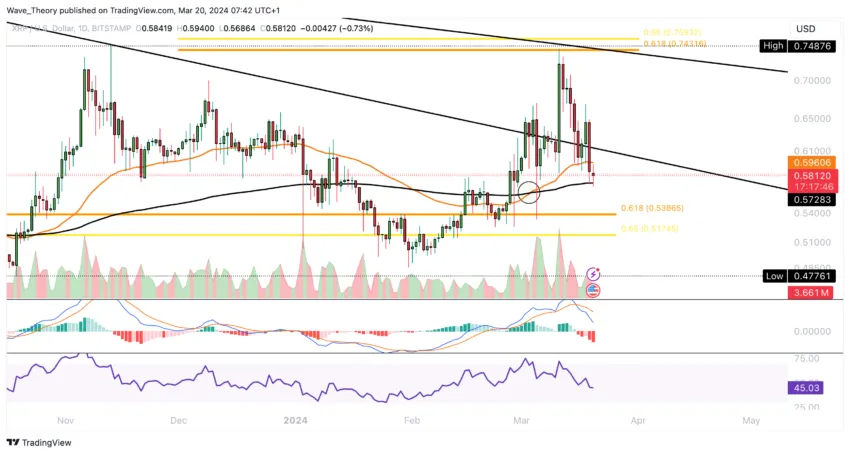
Meanwhile, the RSI is situated in neutral territory, providing neither bullish nor bearish signals.
Watch Out: Death Cross Looms on 4H Chart
In the 4-hour chart, the MACD lines have crossed bearishly, accompanied by a downward trend in the MACD histogram. The RSI is currently situated in neutral territory.
Read More: How to Sell Ripple
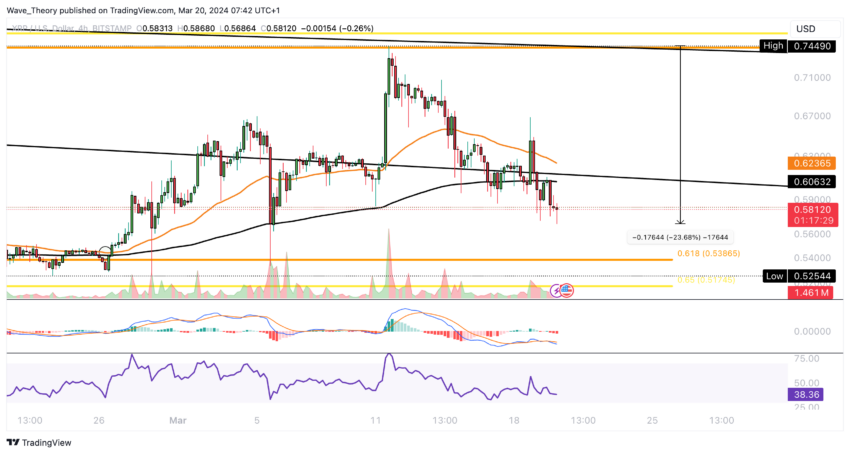
Moreover, there is a possibility of the EMAs forming a death cross soon, which would confirm a bearish trend in the short term. As a result, the price has already experienced a decline of over 22%
XRP Price Descending Against Bitcoin
In the 4-hour chart, the MACD lines have crossed bearishly, accompanied by a downward trend in the MACD histogram. The RSI is currently situated in neutral territory.
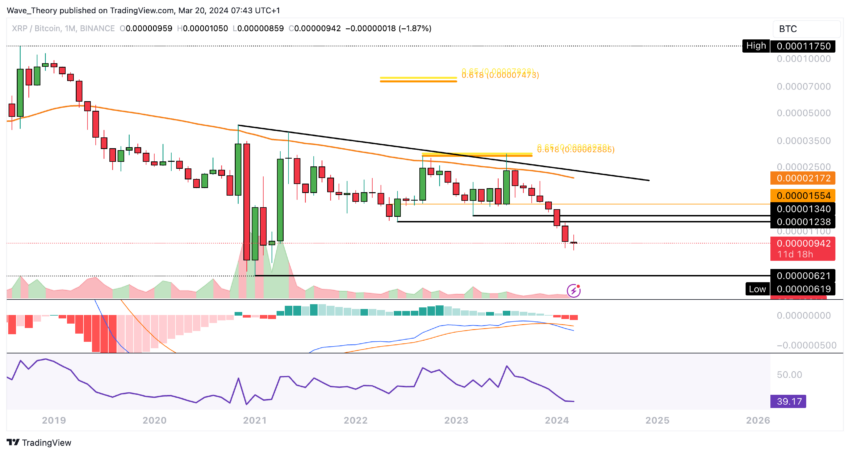
Moreover, there is a possibility of the EMAs forming a death cross soon, which would confirm a bearish trend in the short term. As a result, the price has already experienced a decline of over 22%.
The post XRP Price Rejected at Golden Ratio: What’s Next? appeared first on BeInCrypto.