 Price Increases By 10% Despite Market Downturn")
The Zilliqa (ZIL) price saved a breakdown from the $0.0165 horizontal support area and is now in the process of breaking out from a descending resistance line.
The daily timeframe supports the reclaim of the horizontal support area and indicates that the price is likely to increase.
ZIL Price Saves Breakdown From Long-Term Support
The ZIL price has traded above the $0.0165 area since the beginning of the year. During this time, it has bounced at the area several times. However, each bounce led to the creation of a lower high, considered a sign of weakness. The highs create a descending resistance line.
Read More: Best Upcoming Airdrops in 2023
Last week, it seemed that the cryptocurrency broke down from the $0.0165 area. However, it created a long lower wick (green icon) and reclaimed the area almost immediately afterwards. Now, the price is in the process of breaking out from the descending resistance line. Such deviations and reclaims are bullish signs and they often led to a trend reversal. In any case, ZIL needs to close above the descending resistance line in order to confirm its bullish trend reversal.
Despite this seemingly bullish price action, the RSI is still undetermined. The RSI is a momentum indicator traders use to evaluate whether a market is overbought or oversold, and to determine whether to accumulate or sell an asset. Readings above 50 and an upward trend suggest that bulls still have an advantage, while readings below 50 indicate the opposite.
While the indicator is increasing, it is still below 50. A close above the descending resistance line alongside a RSI movement above 50 will confirm that the trend is bullish.
ZIL Price Prediction: Double Bottom Leads to Increase
The daily timeframe technical analysis supports the continuing of the increase. There are two main reasons for this.
Read More: Best Crypto Sign-Up Bonuses in 2023
Firstly, the price created a double bottom, which is considered a bullish pattern. The double bottom catalyzed the increase that caused the reclaim of the $0.0165 horizontal support area.
Secondly, the double bottom was combined with bullish divergence in the RSI (green line). This is a bullish occurrence when a price decrease is combined with a momentum increase.
This often leads to bullish trend reversals. In the case of ZIL, it caused a breakout from a short-term descending resistance line.
If the increase continues, the next closest resistance area will be at $0.0200, a 13% increase measuring from the current price.
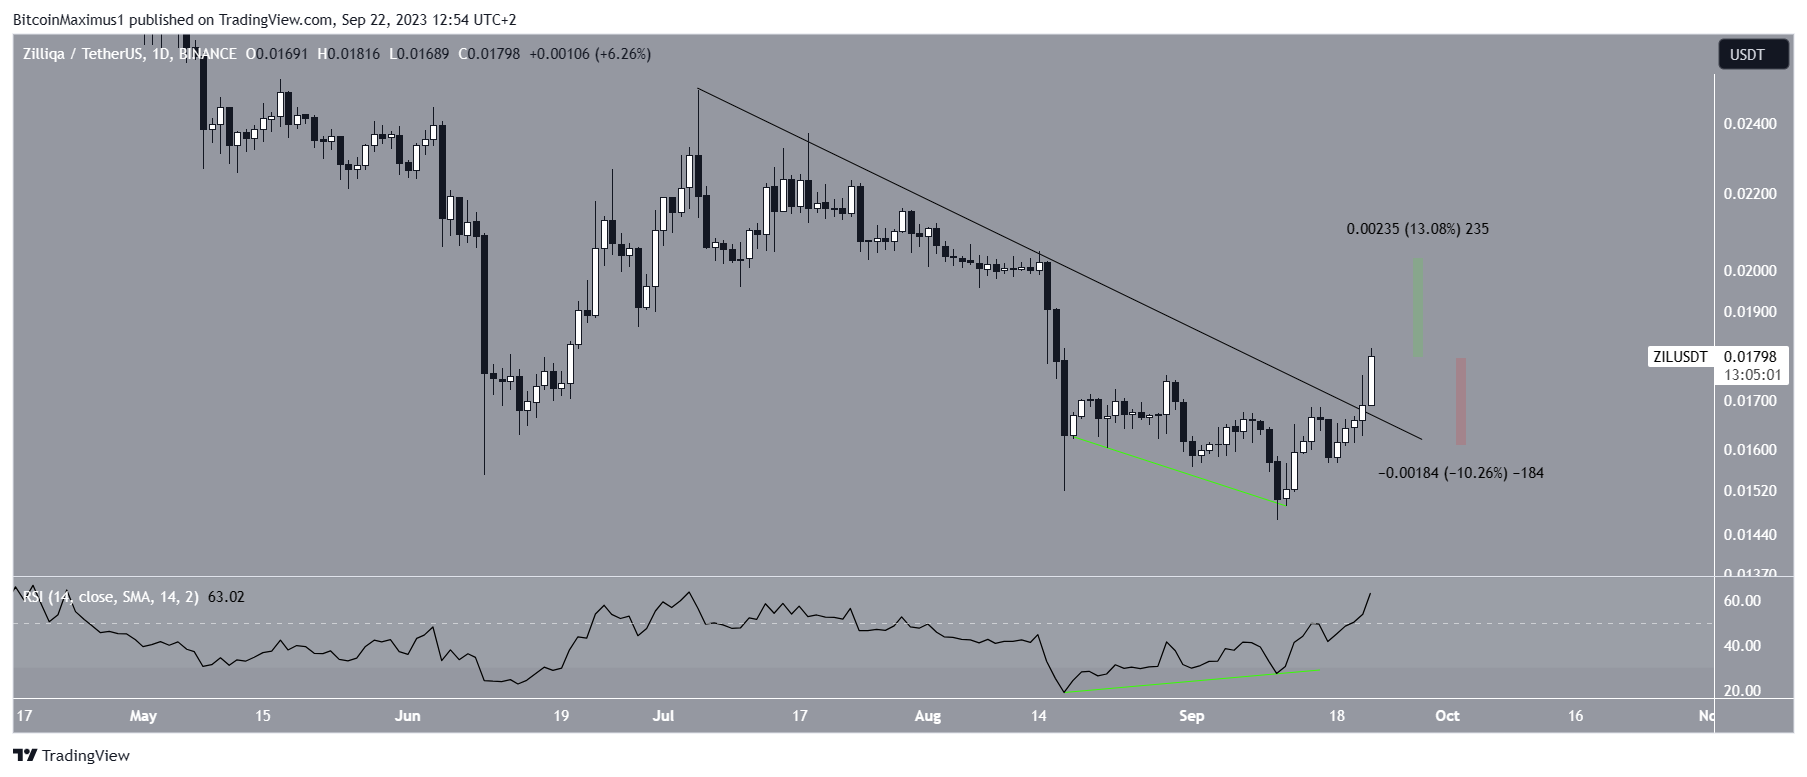
Despite this bullish ZIL price prediction, failure to sustain the increase could cause a drop to the resistance line, which is currently at $0.0160.
This would be a drop of 10% measuring from the current price.
For BeInCrypto’s latest crypto market analysis, click here.
The post Zilliqa (ZIL) Price Increases By 10% Despite Market Downturn appeared first on BeInCrypto.