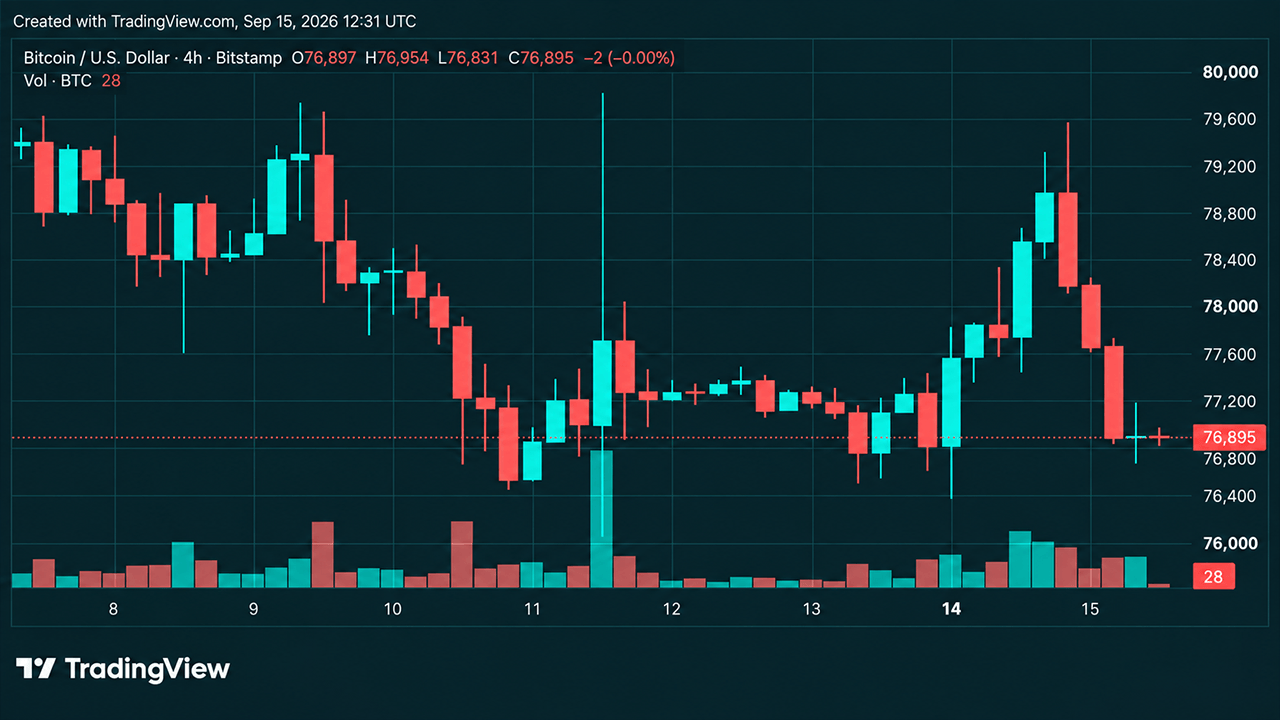
Bitcoin is trading near $76,900 on September 15, 2026, after encountering resistance in the upper-$79,000 range. The price has settled into the $76,000-$76,700 support zone, which has become a critical level for determining the next directional move.
Technical Analysis Across Timeframes
The 1-hour chart shows Bitcoin's price range declining from roughly $79,925 to $76,640 following the rejection. Volume expanded during the larger declines, reinforcing the $76,640-$76,682 cluster as meaningful support. A recovery through $77,500-$77,800 would improve the short-term picture, with $78,500 serving as a more significant hurdle. Below $76,500, support deteriorates further and exposes the $75,500-$76,000 region.
The 4-hour chart displays a pattern of lower highs and lower lows. Bitcoin rallied from a low near $62,470 to $82,281 before entering a period of weakness. The $76,000-$76,600 zone holds technical importance beyond just a round number, with confirmation of a rebound requiring Bitcoin to reclaim $77,800-$78,000. From there, $78,500 and $79,000-$79,600 become the next visible barriers.
The daily chart presents a more constructive narrative. Bitcoin recovered from a June low around $57,735 to reach a swing high near $82,833 before pulling back. The current price remains comfortably inside the larger range from $62,470 to $82,281. Daily support concentrates around $76,000-$77,000, with a convincing daily close below $76,000 potentially opening the door toward $74,000-$75,000.
Indicator Summary
Market oscillators present a semi-neutral picture. The relative strength index reads 53 (neutral), while Stochastic sits at 20 (also neutral). The commodity channel index, average directional index, and awesome oscillator all produce neutral readings. However, momentum and moving average convergence divergence carry bearish signals, while bull bear power provides the lone bullish reading. Overall, indicators show two bearish signals, eight neutral readings, and one bullish signal.
Moving averages split almost evenly between bullish and bearish signals. Shorter-term averages—the 10-period exponential and simple moving averages, 20-period averages, and volume-weighted moving average—lean bearish. Longer-term averages, including the 50-, 100-, and 200-period exponential and simple moving averages, remain bullish. The tally shows seven bearish readings, one neutral, and seven bullish signals.
Key Levels and Scenarios
The $76,000 level serves as the critical line in the sand for Bitcoin's near-term direction. If this support holds, a reclaim of $77,800-$78,000 would strengthen the rebound case, with $78,500 and $79,000-$79,600 as the next upside tests. A sustained break below $76,000 would weaken the broader consolidation and could expose lower support around $74,000-$75,000, followed by the $72,000-$73,000 region.