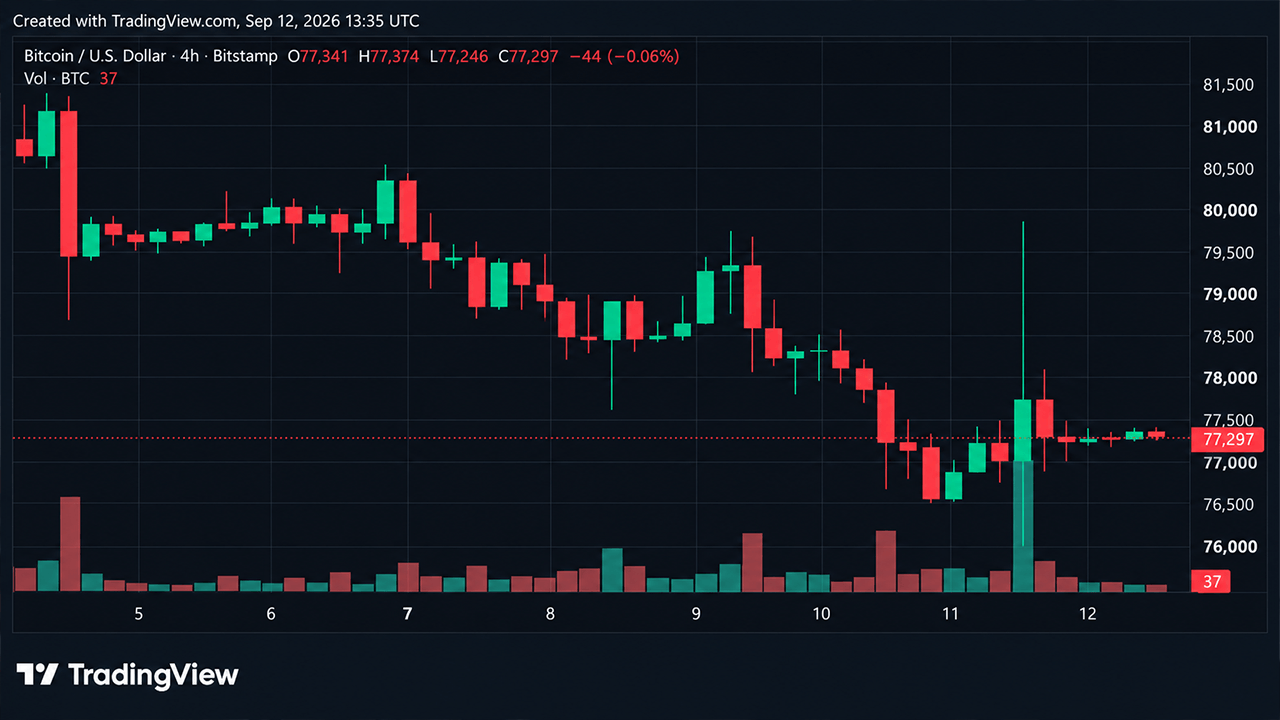
Bitcoin's price hovered near $77,300 on Saturday morning following a dramatic intraday fluctuation that ultimately produced minimal net movement. Despite a $3,215 price swing within 24 hours, bitcoin's net gain remained at just 0.2%, highlighting the disconnect between short-term volatility and broader price direction.
The cryptocurrency found itself wedged between support around $76,040-$76,400 and resistance beginning near $77,970. Technical charts revealed a market caught between competing forces, with buyers and sellers appearing cautious about making the next significant move.
Price Movement and Technical Levels
Bitcoin's recent journey began with a peak near $82,833 in early September before retreating into the mid-$70,000s. The decline marked a pullback from a recovery that started at a $57,735 swing low and climbed through the $80,000s during late summer.
On shorter timeframes, momentum had noticeably cooled. The 1-hour chart showed price action confined to a narrow Saturday range around $77,000-$77,500, while the 4-hour chart displayed a string of lower highs following the mid-$80,000s peak. Volume did increase during the September 11 bounce, providing some encouragement to bulls.
Technical Analysis
Daily oscillators sent mixed signals, with most indicators sitting neutral. The relative strength index stood at 55 (neutral), while Stochastic registered at 15 (neutral). Overall oscillator readings showed one bearish signal, eight neutral signals, and two bullish signals.
Moving averages painted a more optimistic picture for longer-term traders. The 20-period and 30-period exponential moving averages, along with most 50-, 100-, and 200-period indicators, remained bullish. However, shorter-term moving averages including the 10-period exponential moving average at $77,971 and 10-period simple moving average at $78,797 were negative, signaling caution in the near term.
Key Levels Ahead
Bitcoin bulls faced a near-term hurdle at roughly $78,000-$78,800. Breaking through this resistance zone could put the $82,280-$82,830 range back in play. Conversely, bears would view a break below the $76,040-$76,400 support as a significant development.
The longer-term trend structure remained intact despite the recent pullback, with mid-$70,000s support continuing to hold. Technical analysts noted that volume during the recovery from the August low had been heavier than volume during the subsequent drift lower, a potentially positive sign for buyers willing to push through overhead resistance.