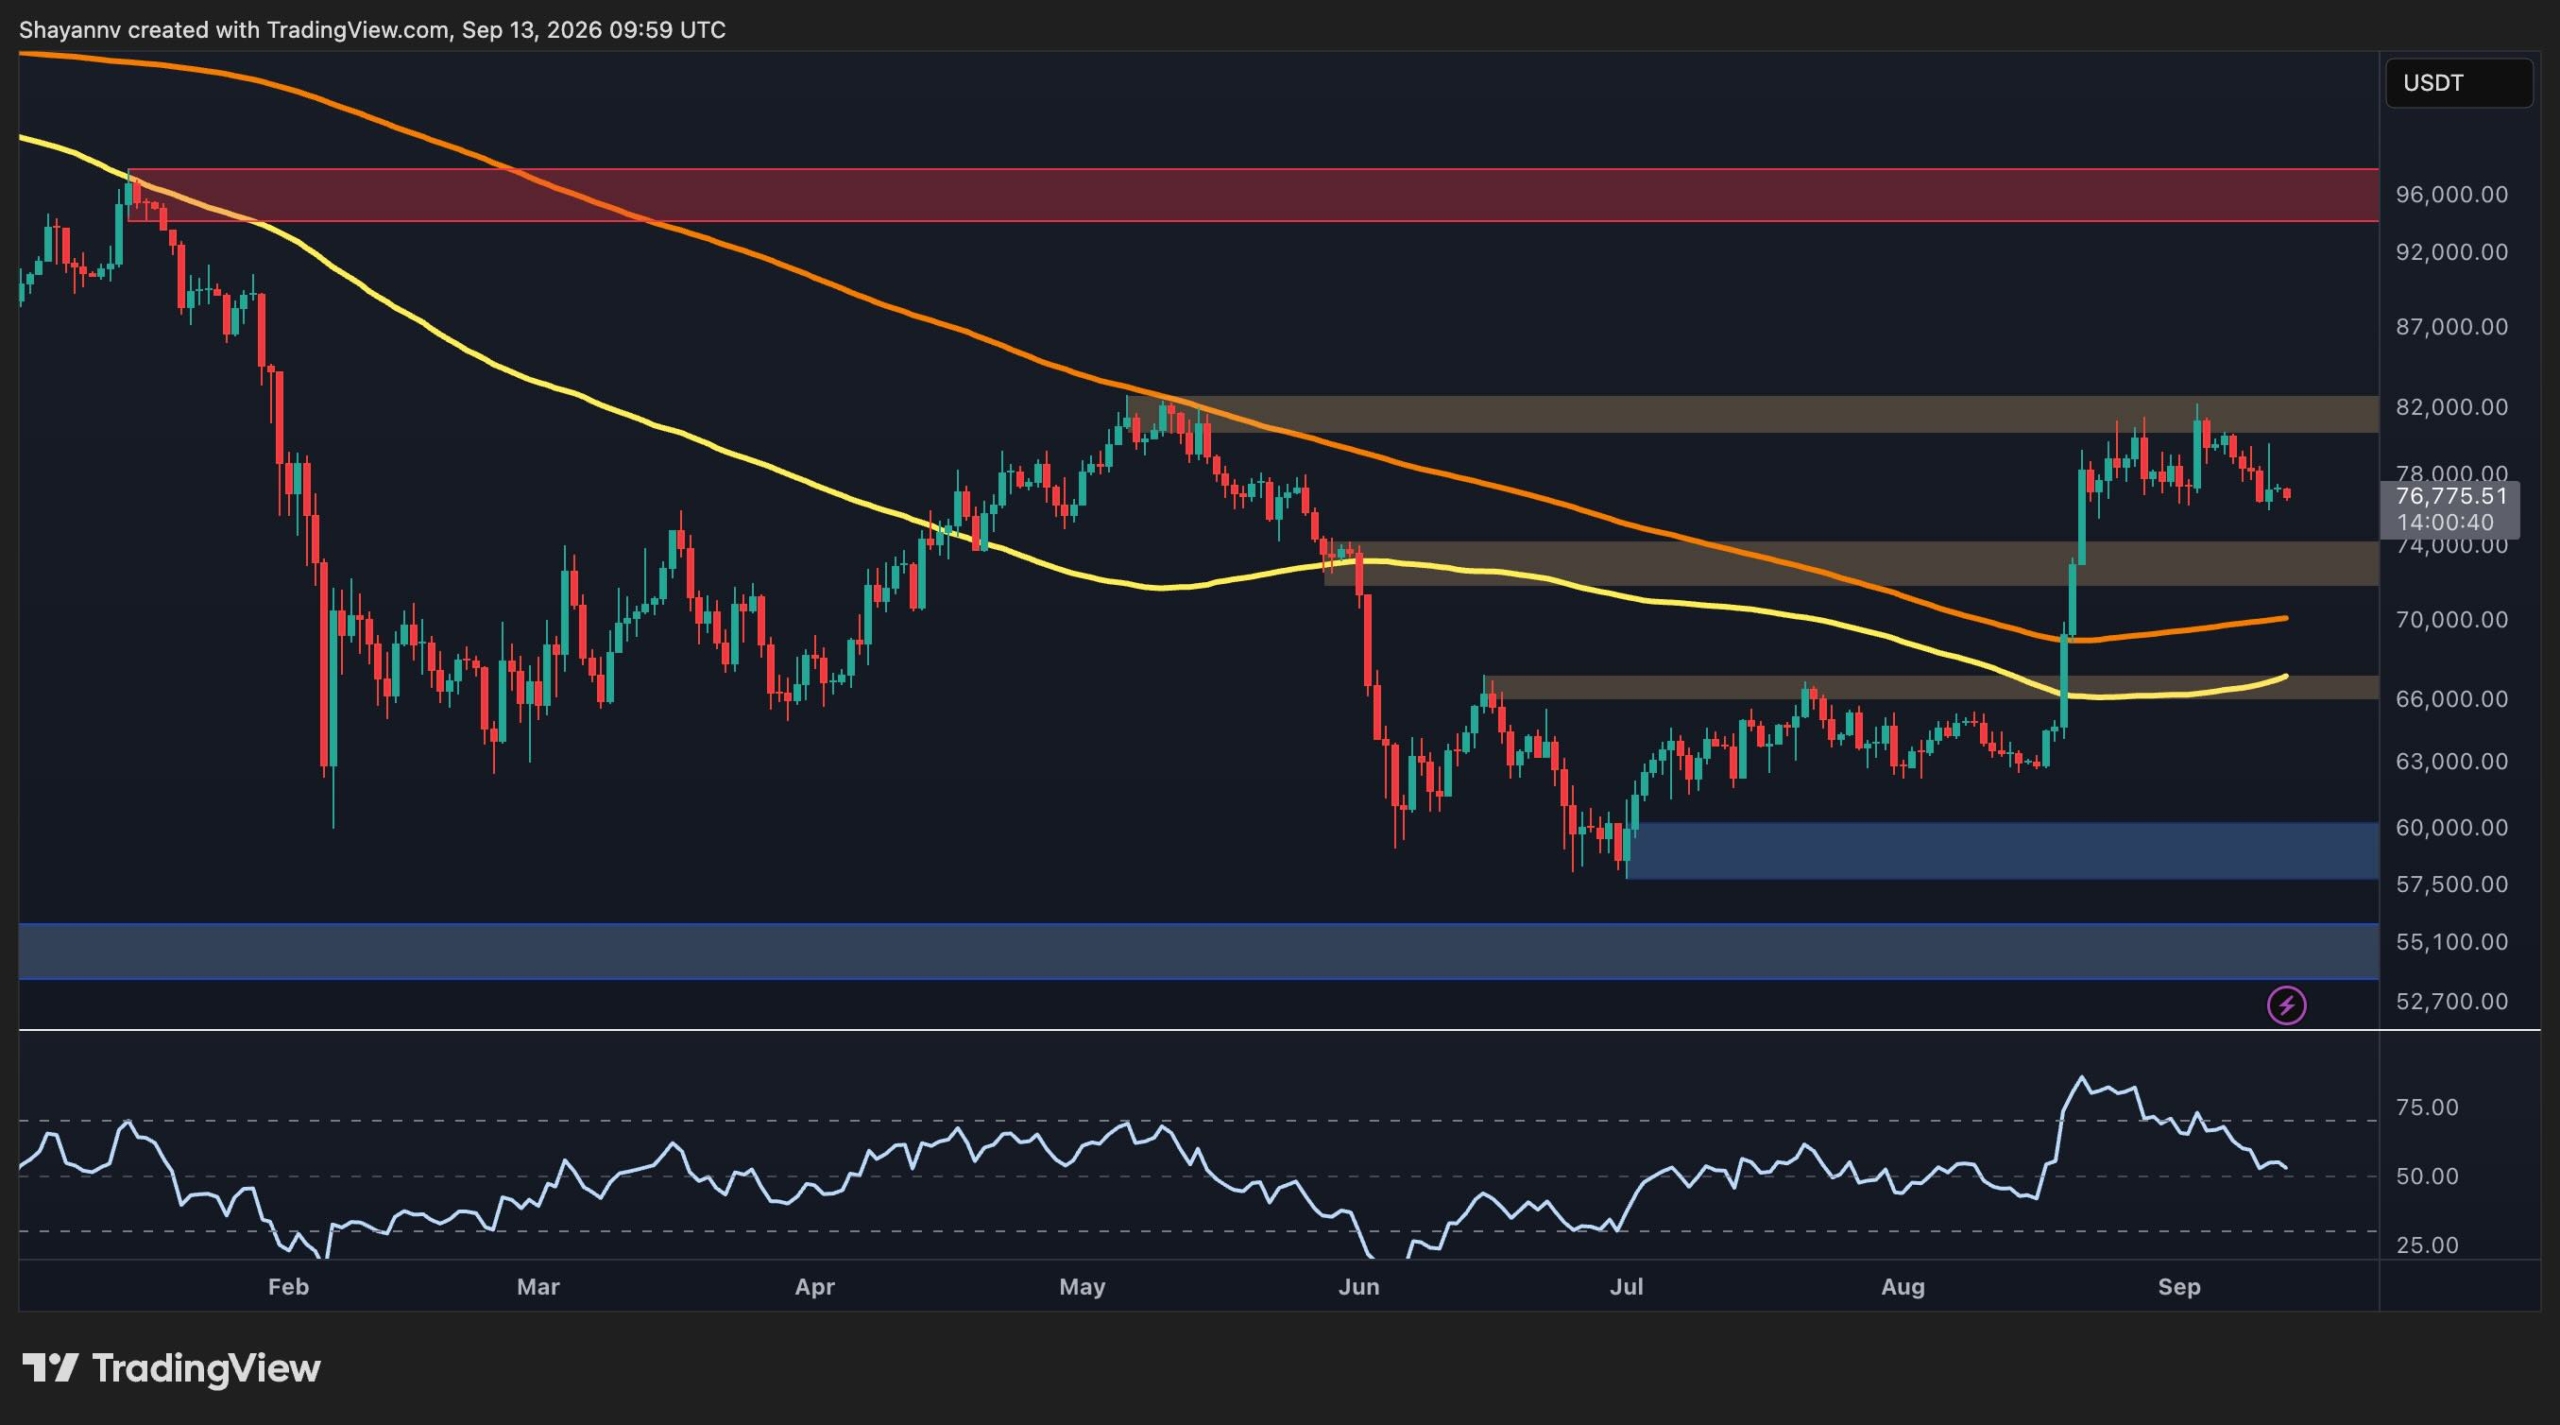
Bitcoin is consolidating around $77.3K after breaking out from the $67K area. The cryptocurrency now faces an important resistance cluster near $80K-$82K, while on-chain metrics suggest US spot demand has not yet fully confirmed the recent advance.
Daily Chart Structure
The daily chart shows significant structural recovery. After falling to the $60K demand zone in June, Bitcoin spent several months building a base before breaking decisively above $67K in late August. The subsequent rally carried BTC through the $72K-$74K zone toward the $80K area.
The $72K-$74K region has become the first major support zone. A successful retest of this area would preserve the bullish structure established by the recent breakout. Below it, the $67K zone represents more important structural support, as it previously capped the market for several months. A deeper correction could bring the $60K demand zone back into focus.
On the upside, BTC is approaching the $80K-$82K resistance zone. A daily close above $82K would be significant, potentially opening the way toward the $90K mark or higher.
4-Hour Chart Consolidation
The 4-hour chart shows Bitcoin staged a sharp breakout from a summer trading range between roughly $60K and $67K, accelerating dramatically through $74K. After reaching the $80K-$82K area, however, the rally lost momentum.
BTC is currently trading around $76.8K and has formed a relatively broad consolidation below resistance. The immediate support sits around the $72K-$74K zone, which represents the previous resistance that BTC cleared during the breakout. Holding this area would maintain the sequence of higher highs and higher lows on the 4-hour timeframe.
Repeated rejection at $80K-$82K followed by a break below $72K could trigger a deeper retracement toward $67K.
On-Chain Demand Signal
The Coinbase Premium Index, which measures the price difference between Bitcoin on Coinbase and other major exchanges as a proxy for US-based spot buying pressure, currently reads around -0.02 with the index back in negative territory.
This divergence is notable because BTC has remained well above the levels seen before the late-August breakout. The negative reading suggests that recent price strength has not been accompanied by a sustained surge in Coinbase buying pressure.
For the bullish scenario to strengthen, a renewed move of the Coinbase Premium into positive territory alongside a breakout above $82K would provide more convincing confirmation. If BTC instead loses $72K while the premium remains negative, it would increase the probability that the recent rally is undergoing a deeper correction.