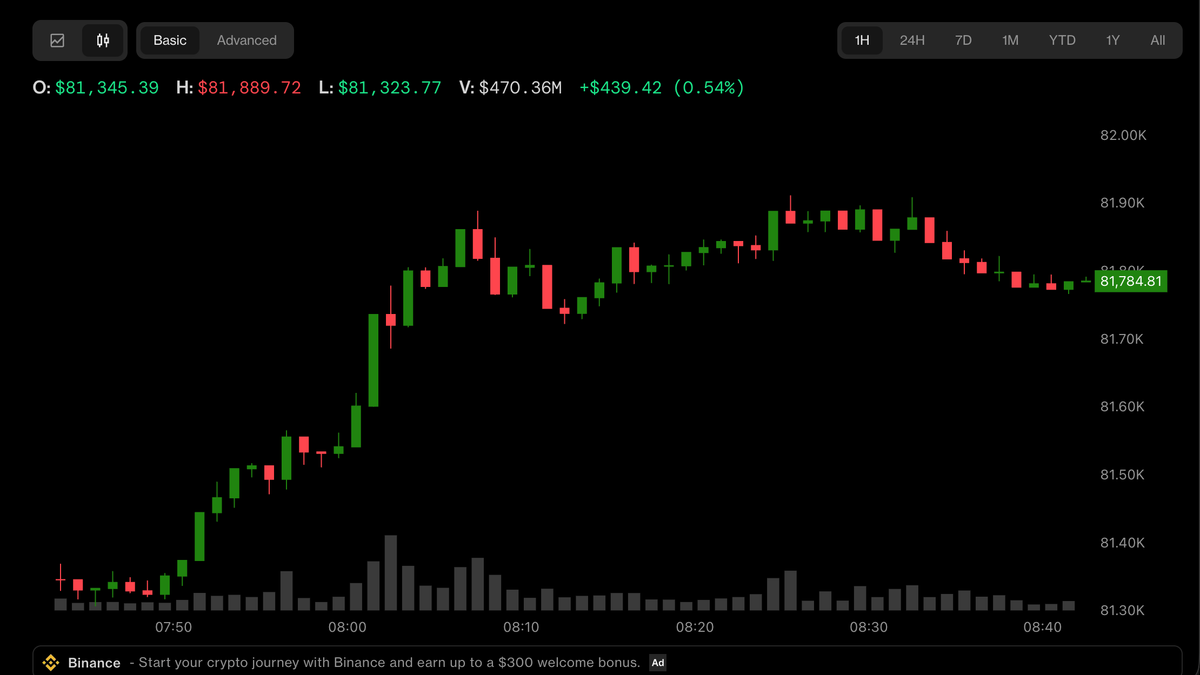
Bitcoin registered an intraday high above $82,000 on September 3, pushing through the 50-week moving average that Galaxy Research identifies as a historical marker for the end of bear markets. However, the move occurred during intraday trading rather than at the weekly close, which is required to confirm the signal.
Galaxy's framework treats the 200-week moving average as Bitcoin's historical bear market floor and the 50-week moving average as its ceiling. In four of the five completed bear markets where Bitcoin fell below this ceiling, the first successful weekly reclaim marked the bottom. The exception occurred in 2021 and 2022, when Bitcoin briefly reclaimed the level twice before falling to a fresh low.
The current bear market's drawdown began near a peak in October 2025 and reached a low near $58,500 at the end of June, representing roughly a 53% decline.
Convergence of Multiple Technical Levels
Several independent analyses point to a clustered resistance zone around $81,000 to $86,000. Glassnode's on-chain research identifies $83,000 to $86,000 as a dense band of long-term-holder supply where the current rally has stalled. At comparable prices, 68% of Bitcoin's supply sits in profit, meaning more coins could be sold into further strength. 21Shares frames $81,000 to $82,000 as the line separating a genuine turn higher from an ordinary bear market bounce.
Mixed Signals on Buyer Demand
The August rally originated from a short squeeze in mid-August that pushed Bitcoin from roughly $63,500 toward $80,000. This move coincided with approximately $2.8 billion in exchange-traded fund inflows and contained funding rates, a pattern more consistent with spot buying and short covering than leveraged longs chasing price.
However, CryptoQuant analyst Darkfost noted that Bitcoin's apparent demand, a measure of whether fresh buying is absorbing newly available supply, turned negative again after a brief recovery in August. Wallets holding more than 100 BTC added roughly 60,000 BTC during August even as smaller holders sold, suggesting mixed participation across different holder categories.
What Comes Next
For the bull case to confirm, Bitcoin must close the week above the 50-week moving average, then clear and hold the $83,000 to $86,000 band on sustained spot demand. If this occurs, the next upside markers would be around $90,000 and eventually $98,000.
The bear case would involve Bitcoin failing the weekly close or losing support back near $76,000 to $78,000, potentially sending it toward $71,800 and eventually the $62,000 to $65,000 zone that marked the accumulation base beneath this year's rally.