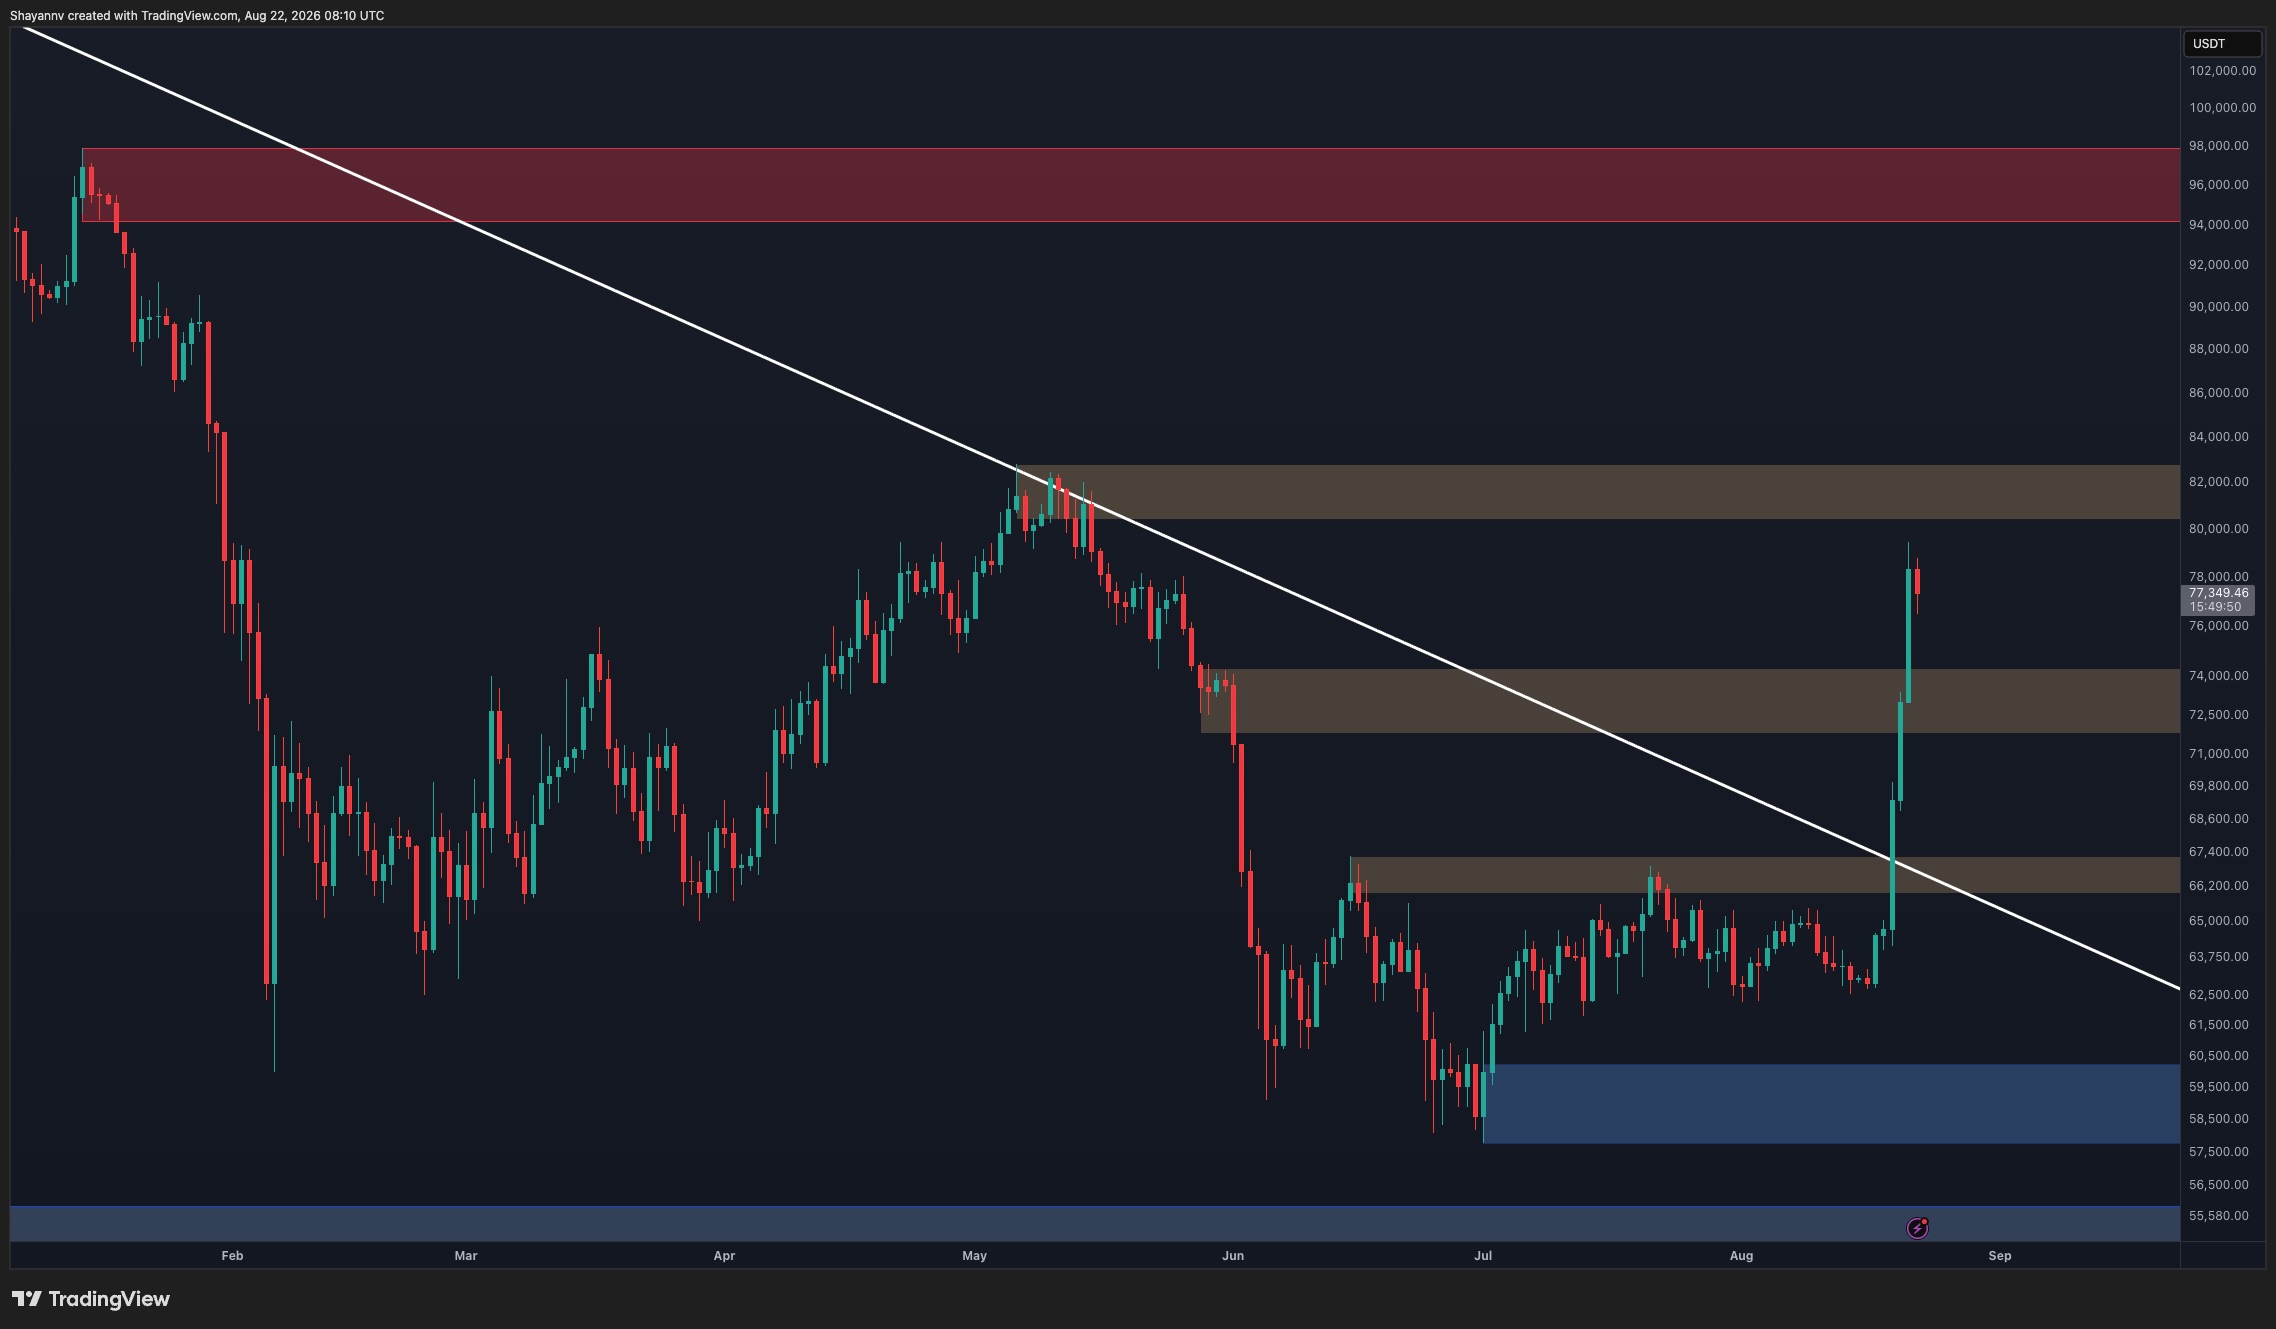
Bitcoin has staged an aggressive breakout following a period of compressed price action, pushing through multiple resistance levels and moving up roughly 25%. The asset cleared a long-standing descending trendline and moved past the $66,000 to $67,000 resistance zone, eventually reaching approximately $79,000 before pulling back toward $77,000.
On the daily timeframe, the price expansion cleared an intermediate $72,000 to $74,000 supply area. Market structure has shifted as buyers reclaim horizontal resistance zones, though the asset is now approaching a major $80,000 to $83,000 resistance zone that previously marked an important swing high.
Analysis of the 4-hour chart demonstrates the vertical nature of the recent advance, which started around the $64,000 to $65,000 range. Because the market is extended from its breakout point, short-term consolidation or a corrective retracement remains a possibility. The $72,000 to $74,000 zone serves as the first significant support area, while Fibonacci retracement levels offer deeper reference points at approximately $71,100, $69,100, $67,700, and $66,300.
On-Chain Metrics and Holder Cost Bases
On-chain data from the Realized Price UTXO Age Bands chart indicates that Bitcoin's surge has pushed the spot price above the realized-price levels of shorter-term cohorts. The 1-3 month and 3-6 month cohorts sit at approximately $64,000 and $74,000, respectively, returning these groups to unrealized profit.
Conversely, several older cohorts maintain realized prices above current market levels. The 18-month to 2-year realized price is situated around $87,000, while the 6-12 month and 12-18 month bands are higher near $95,000 and $105,000.