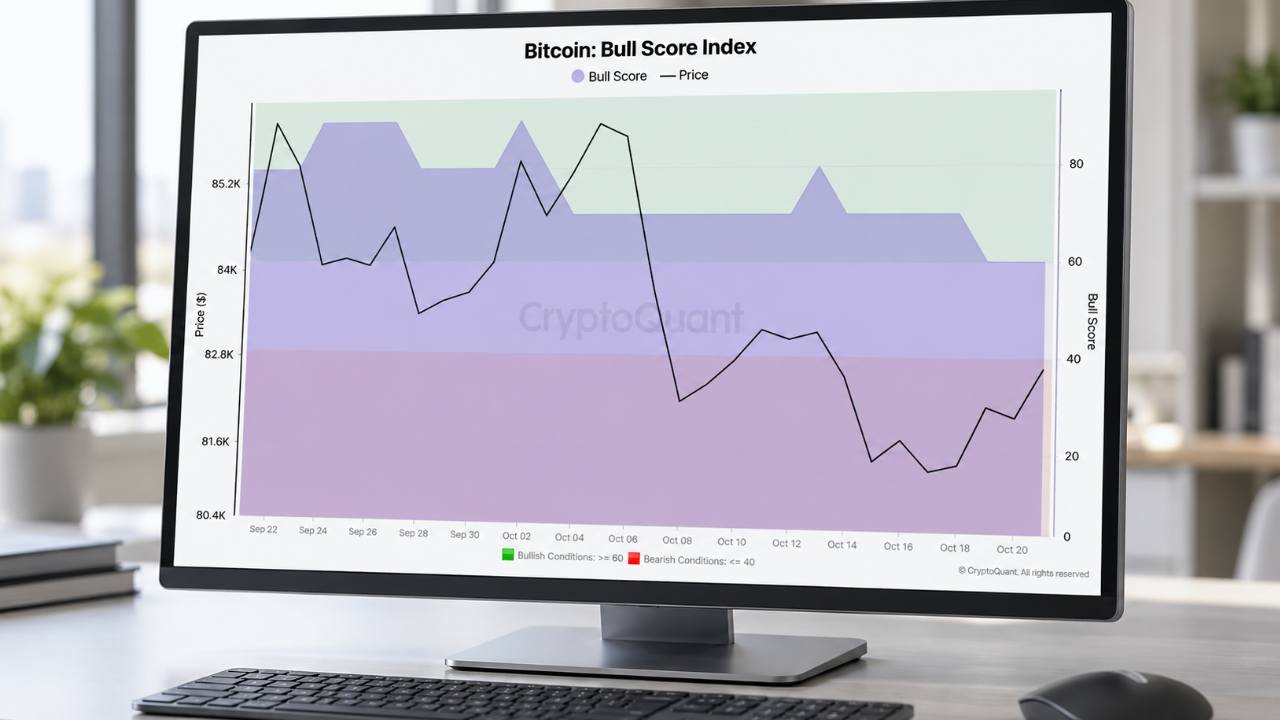
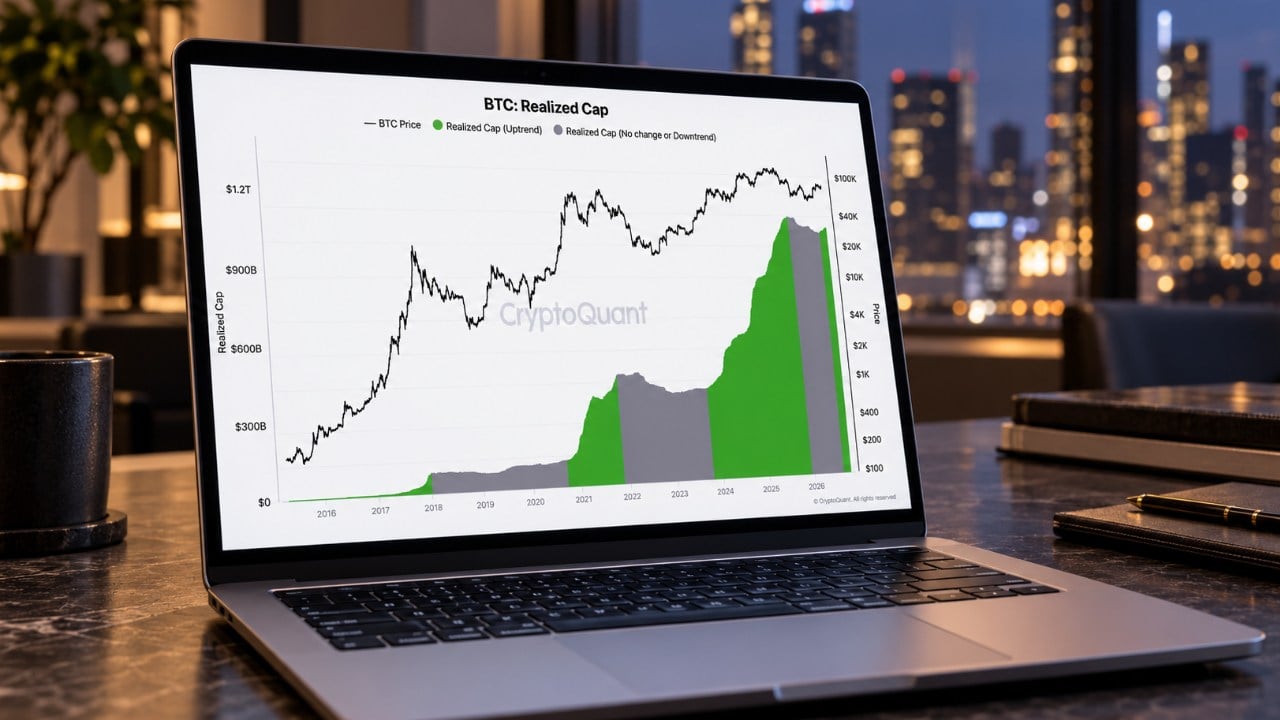
Bitcoin (BTC) has declined more than 1% in September, trading at $77,577 as geopolitical tensions and rate expectations pressure risk assets. The weakness has prompted traders to identify several potential downside levels, with technical analysis and historical patterns suggesting different support zones.
Head and Shoulders Pattern Targets $71,000
Analysts CryptoGoos and Wealthmanager have identified a head and shoulders pattern forming on four-hour Bitcoin charts. According to their analysis, price has already broken below the ascending neckline and is now testing it from below.
Wealthmanager set $71,000 as a downside target should the neckline retest get rejected. The analyst noted that the bearish setup would be invalidated if Bitcoin reclaims and holds above the neckline.
Seasonal Trends Point to Similar Weakness
Historical seasonal data suggests comparable weakness ahead. Bitcoin recorded a 24.95% gain in August, its strongest August performance since 2017.
Analysis of past performance shows that strong August gains have historically been followed by September declines. Across four previous instances where Bitcoin closed August in the green, September declines measured 1.76% in 2013, 7.44% in 2017, 7.51% in 2020, and 7.03% in 2021. The median decline across these instances was 7.24%.
Applying the median to September's opening price of $78,516 would project a level around $72,831. However, these comparisons involve only four instances across 13 years, and the last three Septembers all closed higher, with none following a green August.
On-Chain Data Suggests Lower Support
Structural support identified through on-chain analysis sits considerably below both technical and seasonal targets. Glassnode identifies an accumulation floor between $62,000 and $65,000, which formed during summer consolidation periods.
The firm also flagged a band of long liquidation fuel between $60,000 and $63,000. Long-term holder supply concentration sits between $83,000 and $86,000, potentially capping advances above current levels.
Glassnode stated that the structural floor between $62,000 and $65,000 defines the primary downside reference until overhead supply is absorbed. The interaction between the technical neckline and these on-chain support levels may determine which resistance zone comes into focus first.