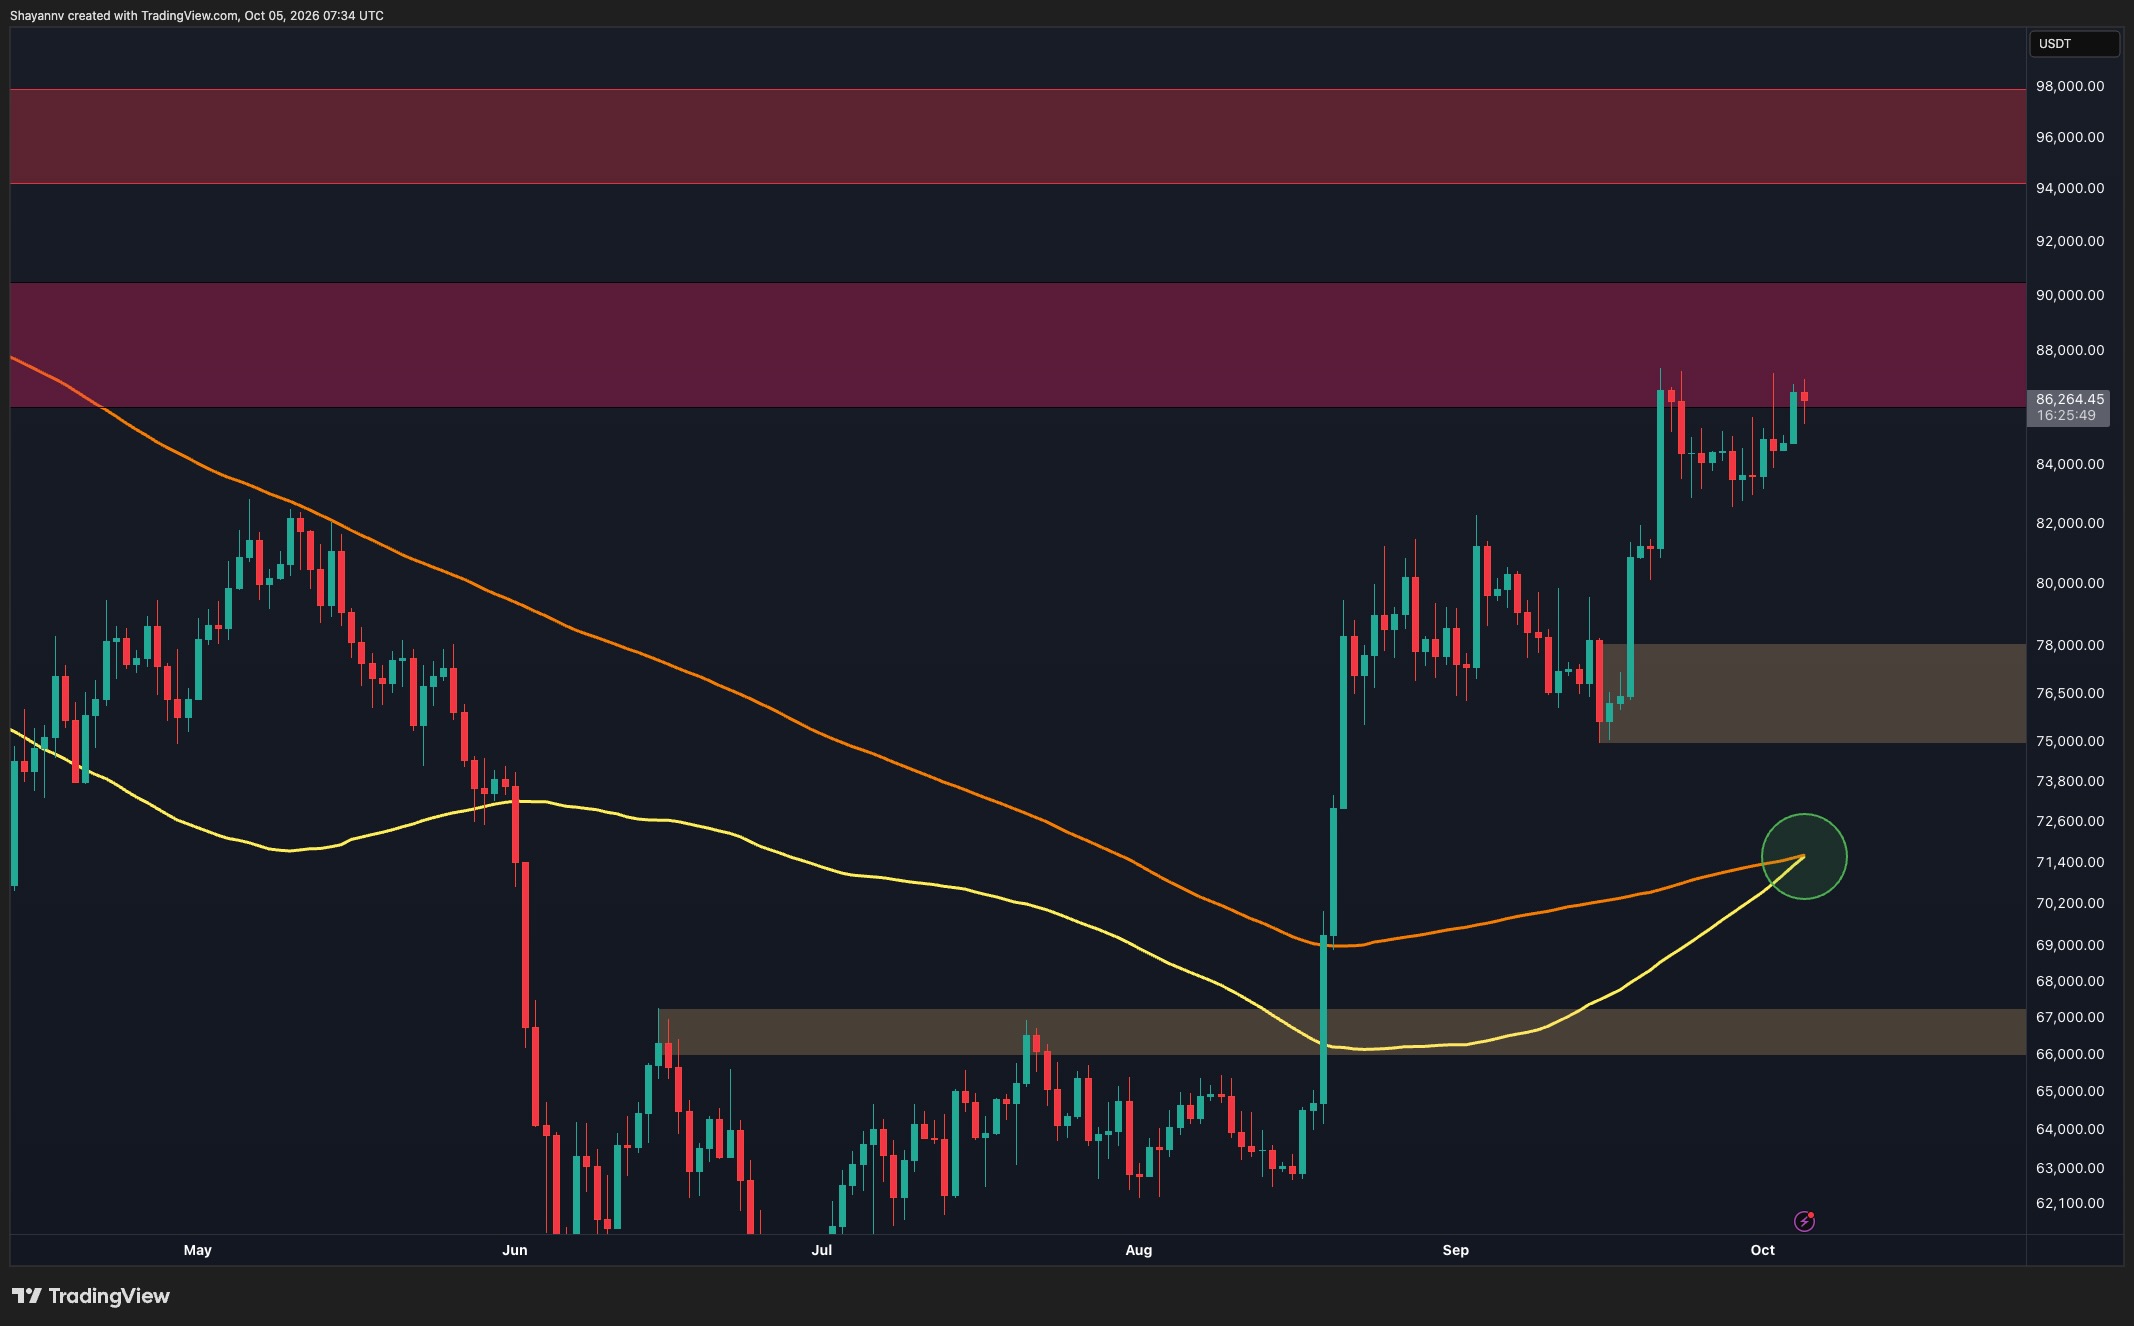
Bitcoin is trading near $85.2K following a recovery from its late-September pullback. The price structure remains within a constructive backdrop, but technical resistance and on-chain cost data suggest buyers continue to face meaningful barriers to further gains.
Daily Chart: Resistance and Moving Average Convergence
On the daily timeframe, Bitcoin is trading in the lower boundary of the $86K–$90K resistance zone after an initial rejection around $87K. Following this rejection, buyers defended the $83K–$84K area and pushed the price back toward recent highs, indicating relatively resilient demand despite the lack of a sustained breakout.
The two moving averages displayed are converging near $71.5K, with the rising yellow average approaching the orange average from below. A potential bullish crossover at this level would reinforce the recovery backdrop, though confirmation remains pending. Bitcoin is trading well above both averages.
A sustained move above the $87K–$87.5K highs could allow Bitcoin to advance into the $88K–$90K resistance area. Clearing that zone would open the way toward the next major supply region at $94K–$98K. A rejection followed by a loss of the $83K support area would increase the risk of a deeper correction, with the $75K–$78K demand zone serving as the main highlighted support below.
4-Hour Chart: Ascending Triangle Formation
The 4-hour chart shows an ascending triangle developing within a broader rising channel. Repeated highs around $87K–$87.3K form a relatively flat resistance boundary, while an ascending trendline supports progressively higher lows. Bitcoin is currently near the upper portion of this formation after another test of overhead resistance.
A decisive 4-hour close above $87.3K with sustained acceptance at that level could support a move toward $89K–$90K. The ascending triangle support currently sits around $84.5K–$85K. Losing this trendline would weaken the continuation setup and expose recent lows around $82.5K–$83K, with the broader channel midpoint near $81K and the $75K–$78K demand zone following below.
On-Chain Cost Basis Data
On-chain analysis of holder cost bases reveals a significant cluster near $88K–$89K. At the current price of $85K, Bitcoin remains above the realized prices of the 1-to-3-month and 3-to-6-month holder cohorts, both in aggregate unrealized profit. However, the price remains below the closely aligned realized prices of the 18-month-to-2-year and 6-to-12-month cohorts, both near $88K–$89K.
This cost-basis cluster overlaps with the daily technical resistance zone, adding significance to the $88K–$90K area as a potential supply region. A sustained move above $89K–$90K would place Bitcoin above both cohort cost bases and strengthen the bullish continuation scenario.