Bitcoin Tests Major Resistance at $80K
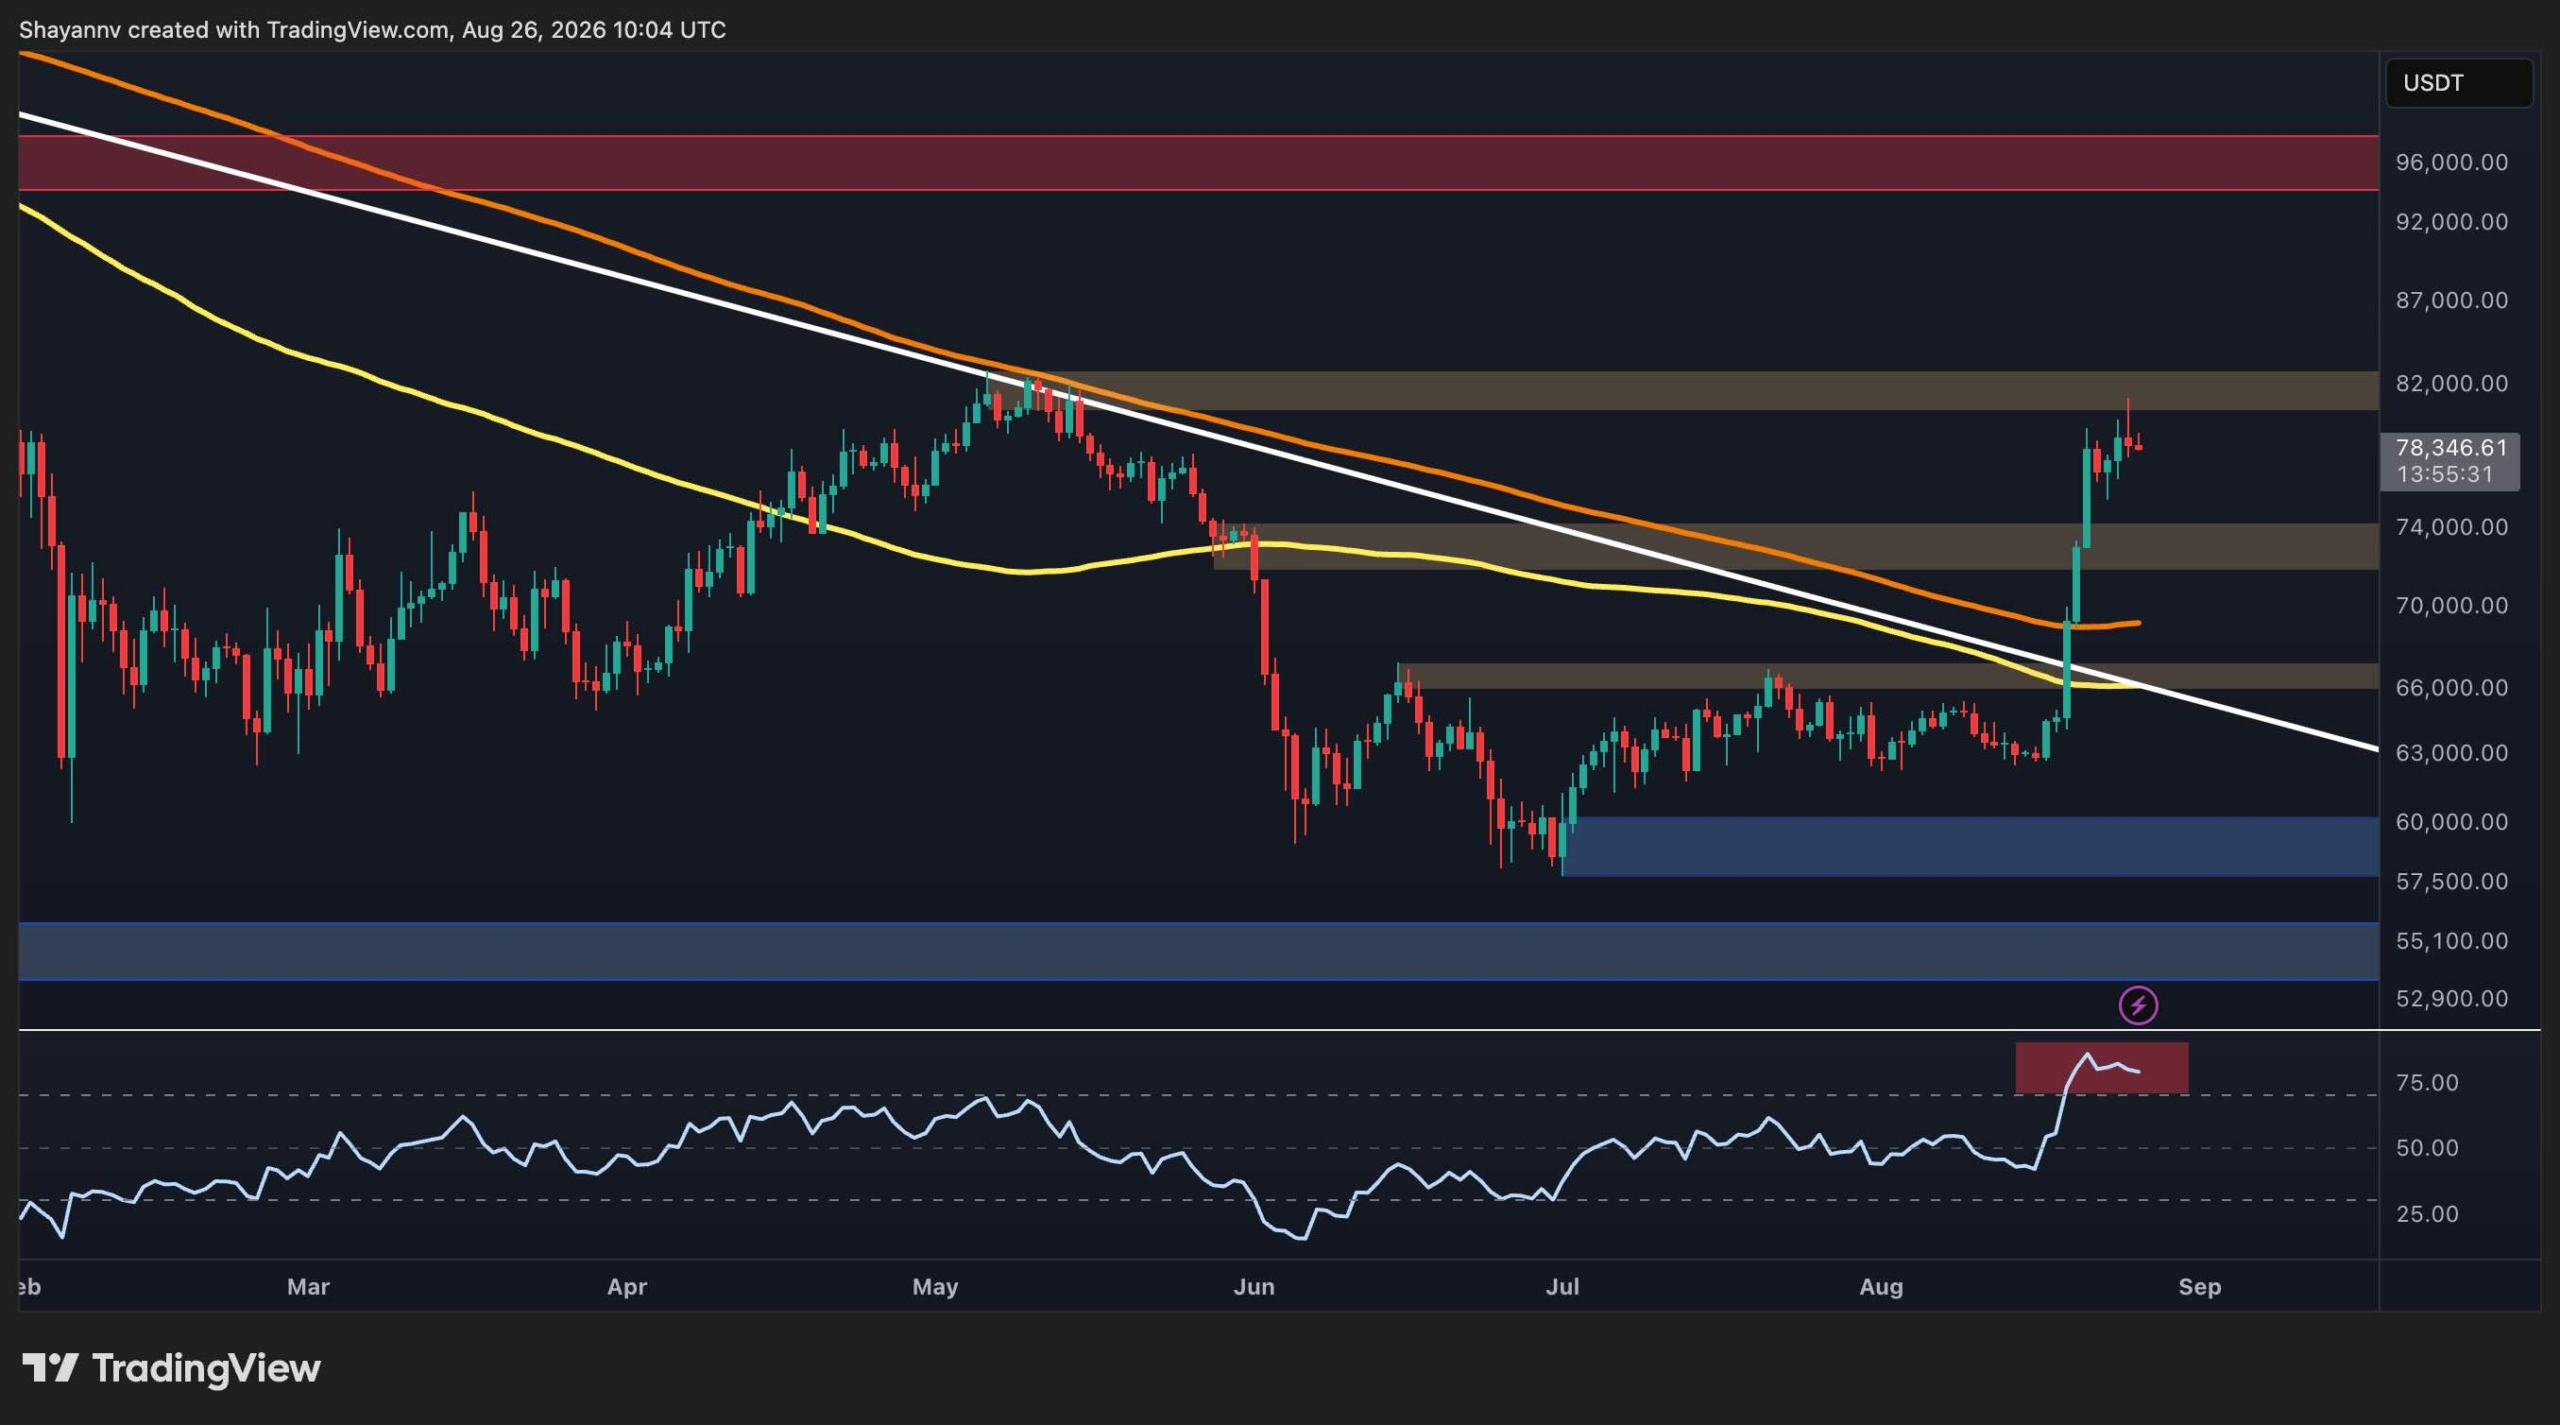
Bitcoin has staged a sharp recovery from the $60K demand zone, breaking through several technical barriers and reclaiming the $72K to $74K area. The upward movement pushed BTC toward the $80K resistance region, where momentum has begun to exhibit signs of exhaustion. Concurrently, the on-chain environment has shown material improvement as market participants resume profit-taking.
Technical Performance on Daily and 4-Hour Charts
The daily chart indicates a structural improvement following months of consolidation below a descending trendline within a $60K to $67K range. Bitcoin is now trading above both the 100-day moving average at approximately $66K and the 200-day moving average at around $70K, both of which have begun to flatten or trend upward. However, the $80K to $82K region presents a significant technical obstacle near recent local highs.
Near-term momentum remains a focal point, with the daily Relative Strength Index surging into overbought territory following the vertical rally. On the 4-hour chart, a visible bearish divergence has emerged, with the price forming a higher high while the RSI records a lower high. While the broader breakout structure remains bullish, this divergence indicates weakening short-term momentum as the price consolidates near $78K.
Key Support and Resistance Levels
Immediate resistance is established at the $80K zone. A confirmed 4-hour close above this threshold followed by a successful retest would provide further confirmation of the ongoing breakout. On the downside, the $72K to $74K band serves as the primary near-term support level, maintaining the intact breakout structure if held. Should Bitcoin fall below this range, the next major test lies near the $64K original consolidation zone.
On-Chain Metrics Indicate Profit Recovery
On-chain data analyzed through the adjusted Spent Output Profit Ratio (aSOPR) supports the price recovery. Measuring whether spent coins are realized at a profit or loss, the metric spent a prolonged period below 1.0 during previous corrections before rebounding sharply. The 30-day exponential moving average of aSOPR has now risen above the 1.0 threshold, reflecting a return of profitable spending alongside the price recovery.