Bitcoin traded between $78,400 and $78,743 on Thursday morning, up 2.5% over 24 hours as buyers held above a key support level of $76,229. Resistance near $79,000 continued to limit the recovery, leaving the price range-bound within a broader upswing.
The 1-hour chart showed a choppy advance following a rebound from $76,229, with the price reaching a local high of $78,743 before stalling beneath that level. Volume during the rebound remained below levels seen during the previous day's decline, indicating the recovery lacked the volume confirmation typically associated with a clean breakout.
On the 4-hour timeframe, bitcoin displayed a flush-and-reclaim pattern—a sharp drop to $76,229 followed by recovery toward the $77,700 to $78,100 zone. The bounce produced higher lows but recovery volume proved weaker than the volume during the decline, limiting evidence for a fresh trend leg.
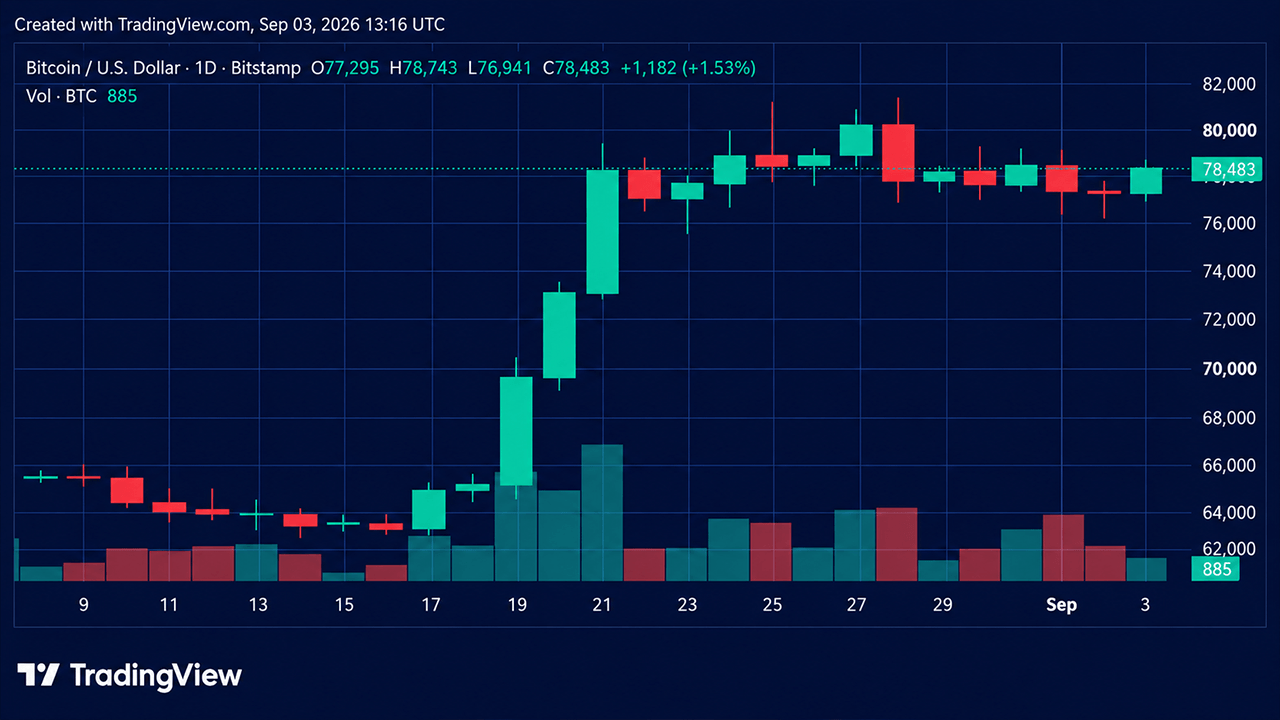
The daily chart revealed bitcoin had advanced from an August baseline of approximately $62,216 to reach roughly $81,455 before entering consolidation. The seven-day range stood at $76,297 to $81,281, with the price positioned in the middle-to-upper portion of that band.
Technical Readings Show Mixed Signals
Daily oscillators presented a neutral picture. The relative strength index registered 67, below the overbought threshold of 70. The Stochastic oscillator stood at 68, the commodity channel index at 42, and the average directional index at 43, all rated neutral. Momentum and the moving average convergence divergence carried bearish readings.
Moving averages painted a more bullish scenario. The exponential and simple moving average stacks showed predominantly bullish signals, with bitcoin trading above most longer-period averages except the 10-period SMA at $78,287.
Key Levels and Scenarios
Critical support held at $76,229, with secondary support between $76,500 and $76,900. Immediate resistance sat around $78,900 to $79,000, followed by $79,200 and then $81,280. A daily close above $81,280 would mark an upside trigger, while a close below $76,230 to $76,300 would weaken the structure and reopen lower areas around $74,600 and then $71,000 to $72,900.
Bitcoin remained range-bound pending a confirmed move beyond the established boundaries. Until then, the technical picture supported monitoring the range edges rather than treating the midrange rebound as a confirmed new directional leg, particularly given neutral oscillator readings despite the strongly bullish moving average alignment.