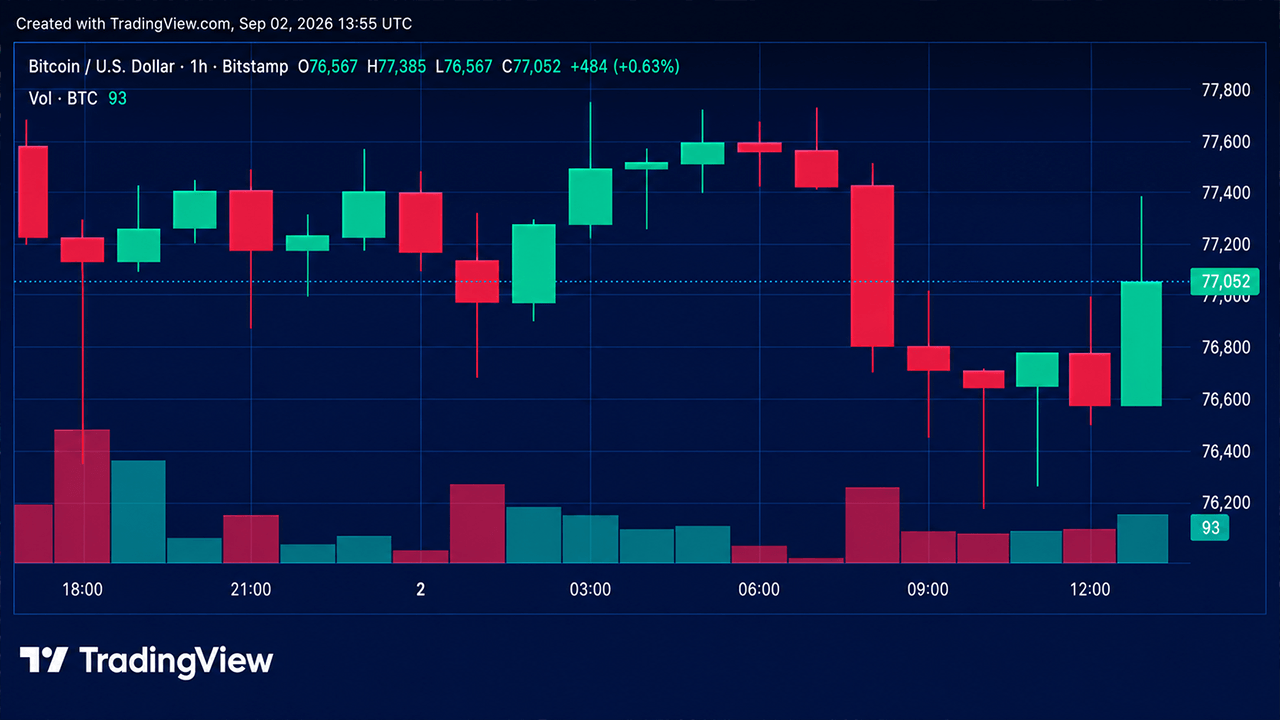
Bitcoin's price consolidated around $76,400 to $77,100 on Wednesday morning, retreating from its August 28 high of $81,455 per coin. Despite the pullback, bitcoin remained up 17.8% over the daily period, with traders focused on key technical levels as short-term weakness intersects with longer-term bullish moving average structures.
Intraday Volatility and Support Levels
On the 1-hour chart, bitcoin declined 2.2% from $78,542 to $76,810, testing an intraday low of $76,229 before recovering to $76,775. The $76,229 support level came into play twice on the 4-hour chart, where bitcoin logged a 0.66% decline to $76,819. Buyers demonstrated interest at the lower levels, though trading volume on recent recovery attempts remained notably lighter than during the preceding selloff.
Resistance and Support Framework
On shorter timeframes, support sits between $75,000 and $76,000, with real resistance beginning at $78,000 to $79,000. A close above $78,000 would signal that the latest selloff has been absorbed. Conversely, a close below $76,000 would weaken the technical picture further and invalidate the recent bounce.
The daily chart shows support running from $76,000 toward the 20-period volume-weighted moving average at $75,055 and the 20-period exponential moving average at $74,594. Resistance extends from $77,747 through approximately $79,250.
Mixed Technical Signals
The daily chart's oscillators sent conflicting messages, with nine of eleven indicators in neutral territory. The relative strength index registered 63, while the Stochastic logged 75. Momentum and moving average convergence divergence showed bearish signals, suggesting an oversold washout is not imminent.
Moving averages presented a split picture, with roughly 11 bullish signals against three bearish ones on the daily chart. Shorter-term moving averages logged selling pressure, while the 20-, 30-, 50-, 100-, and 200-period averages maintained a positive trend, underscoring the tension between near-term and longer-term conditions.
What Traders Are Watching
The technical landscape hinges on whether bitcoin can reclaim $77,000 and push through overhead resistance. A successful move above $78,000 would suggest recent weakness represents a pullback rather than a breakdown. Failure to hold above $76,000 would mark a more significant deterioration in the technical setup.