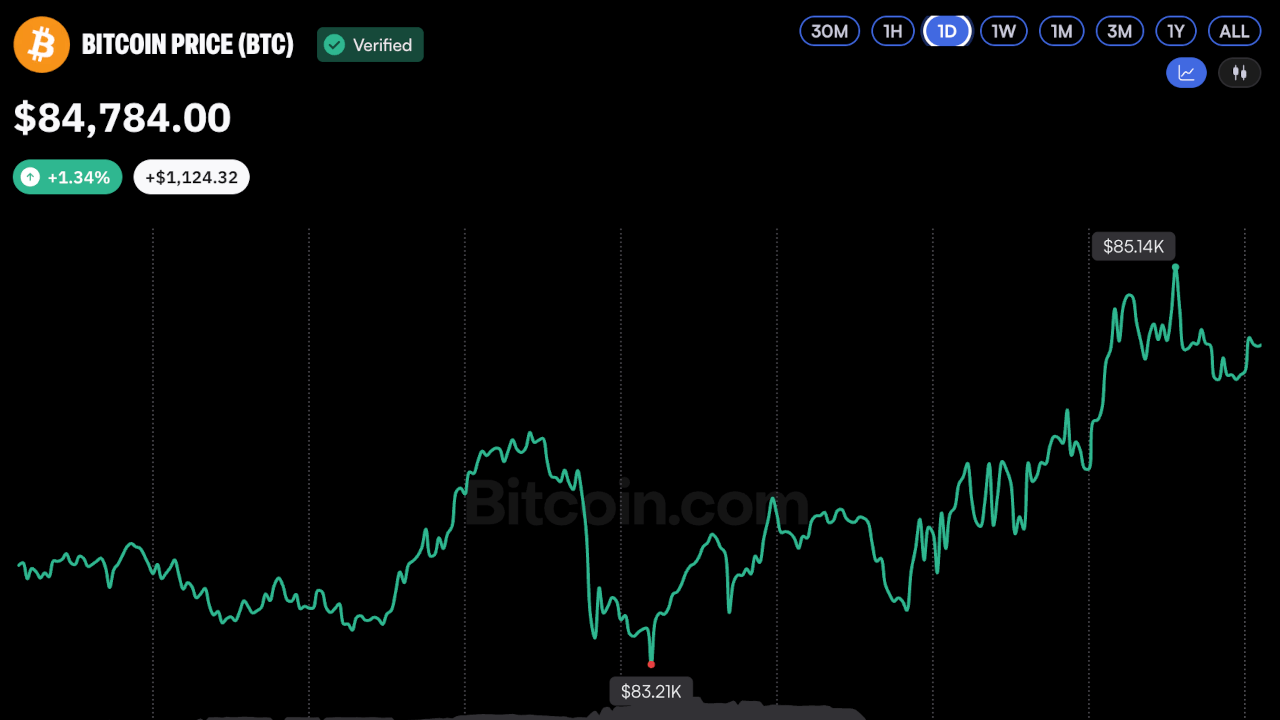
Bitcoin is entering October with institutional support and favorable seasonal tailwinds, though upcoming economic data could prove decisive for price direction.
BTC ended September at $83,563, trading above its estimated $54,000 realized price and the 200-week moving average near $66,000. Approximately 71% of bitcoin supply was in profit at month-end. As of October 1, the top cryptocurrency by market cap is trading near $85,000.
From 2013 through 2025, bitcoin has posted positive October returns in 10 of 13 years, with average gains near 19% and median gains in the low-teens. This history has renewed focus on the seasonal "Uptober" pattern.
Support and Resistance Levels
Bitcoin closed September above $82,500, a level traders have been monitoring as monthly resistance. Analysts have identified $82,000 as a key downside level and $87,500 as an upside trigger. According to Bitget Wallet research, a clean move above $87,500 could open the path toward $95,000, while a sustained break below $80,000 would weaken the bullish setup.
Institutional Demand
U.S. spot bitcoin ETFs attracted $2.4 billion last week in their best week since October 2025. Corporate purchases have also continued, with MicroStrategy acquiring another 1,665 BTC, bringing its holdings to 847,666 BTC—a stash valued near $72 billion as of October 1.
Derivatives leverage has cooled, with Binance perpetual funding remaining positive but not extreme. Bitcoin open interest has fallen about 16% from a week earlier to $7.7 billion, reducing some liquidation risk.
Macro Data Tests Ahead
September U.S. employment data arrives October 2, followed by CPI on October 14 and the Federal Reserve decision on October 28. GDP and PCE data arrive a day later.
Analysts expect macro releases to outweigh crypto-specific catalysts this month, with inflation, employment, and interest-rate expectations potentially overriding seasonal patterns. The next few weeks will test whether institutional buyers can sustain momentum through these data releases.