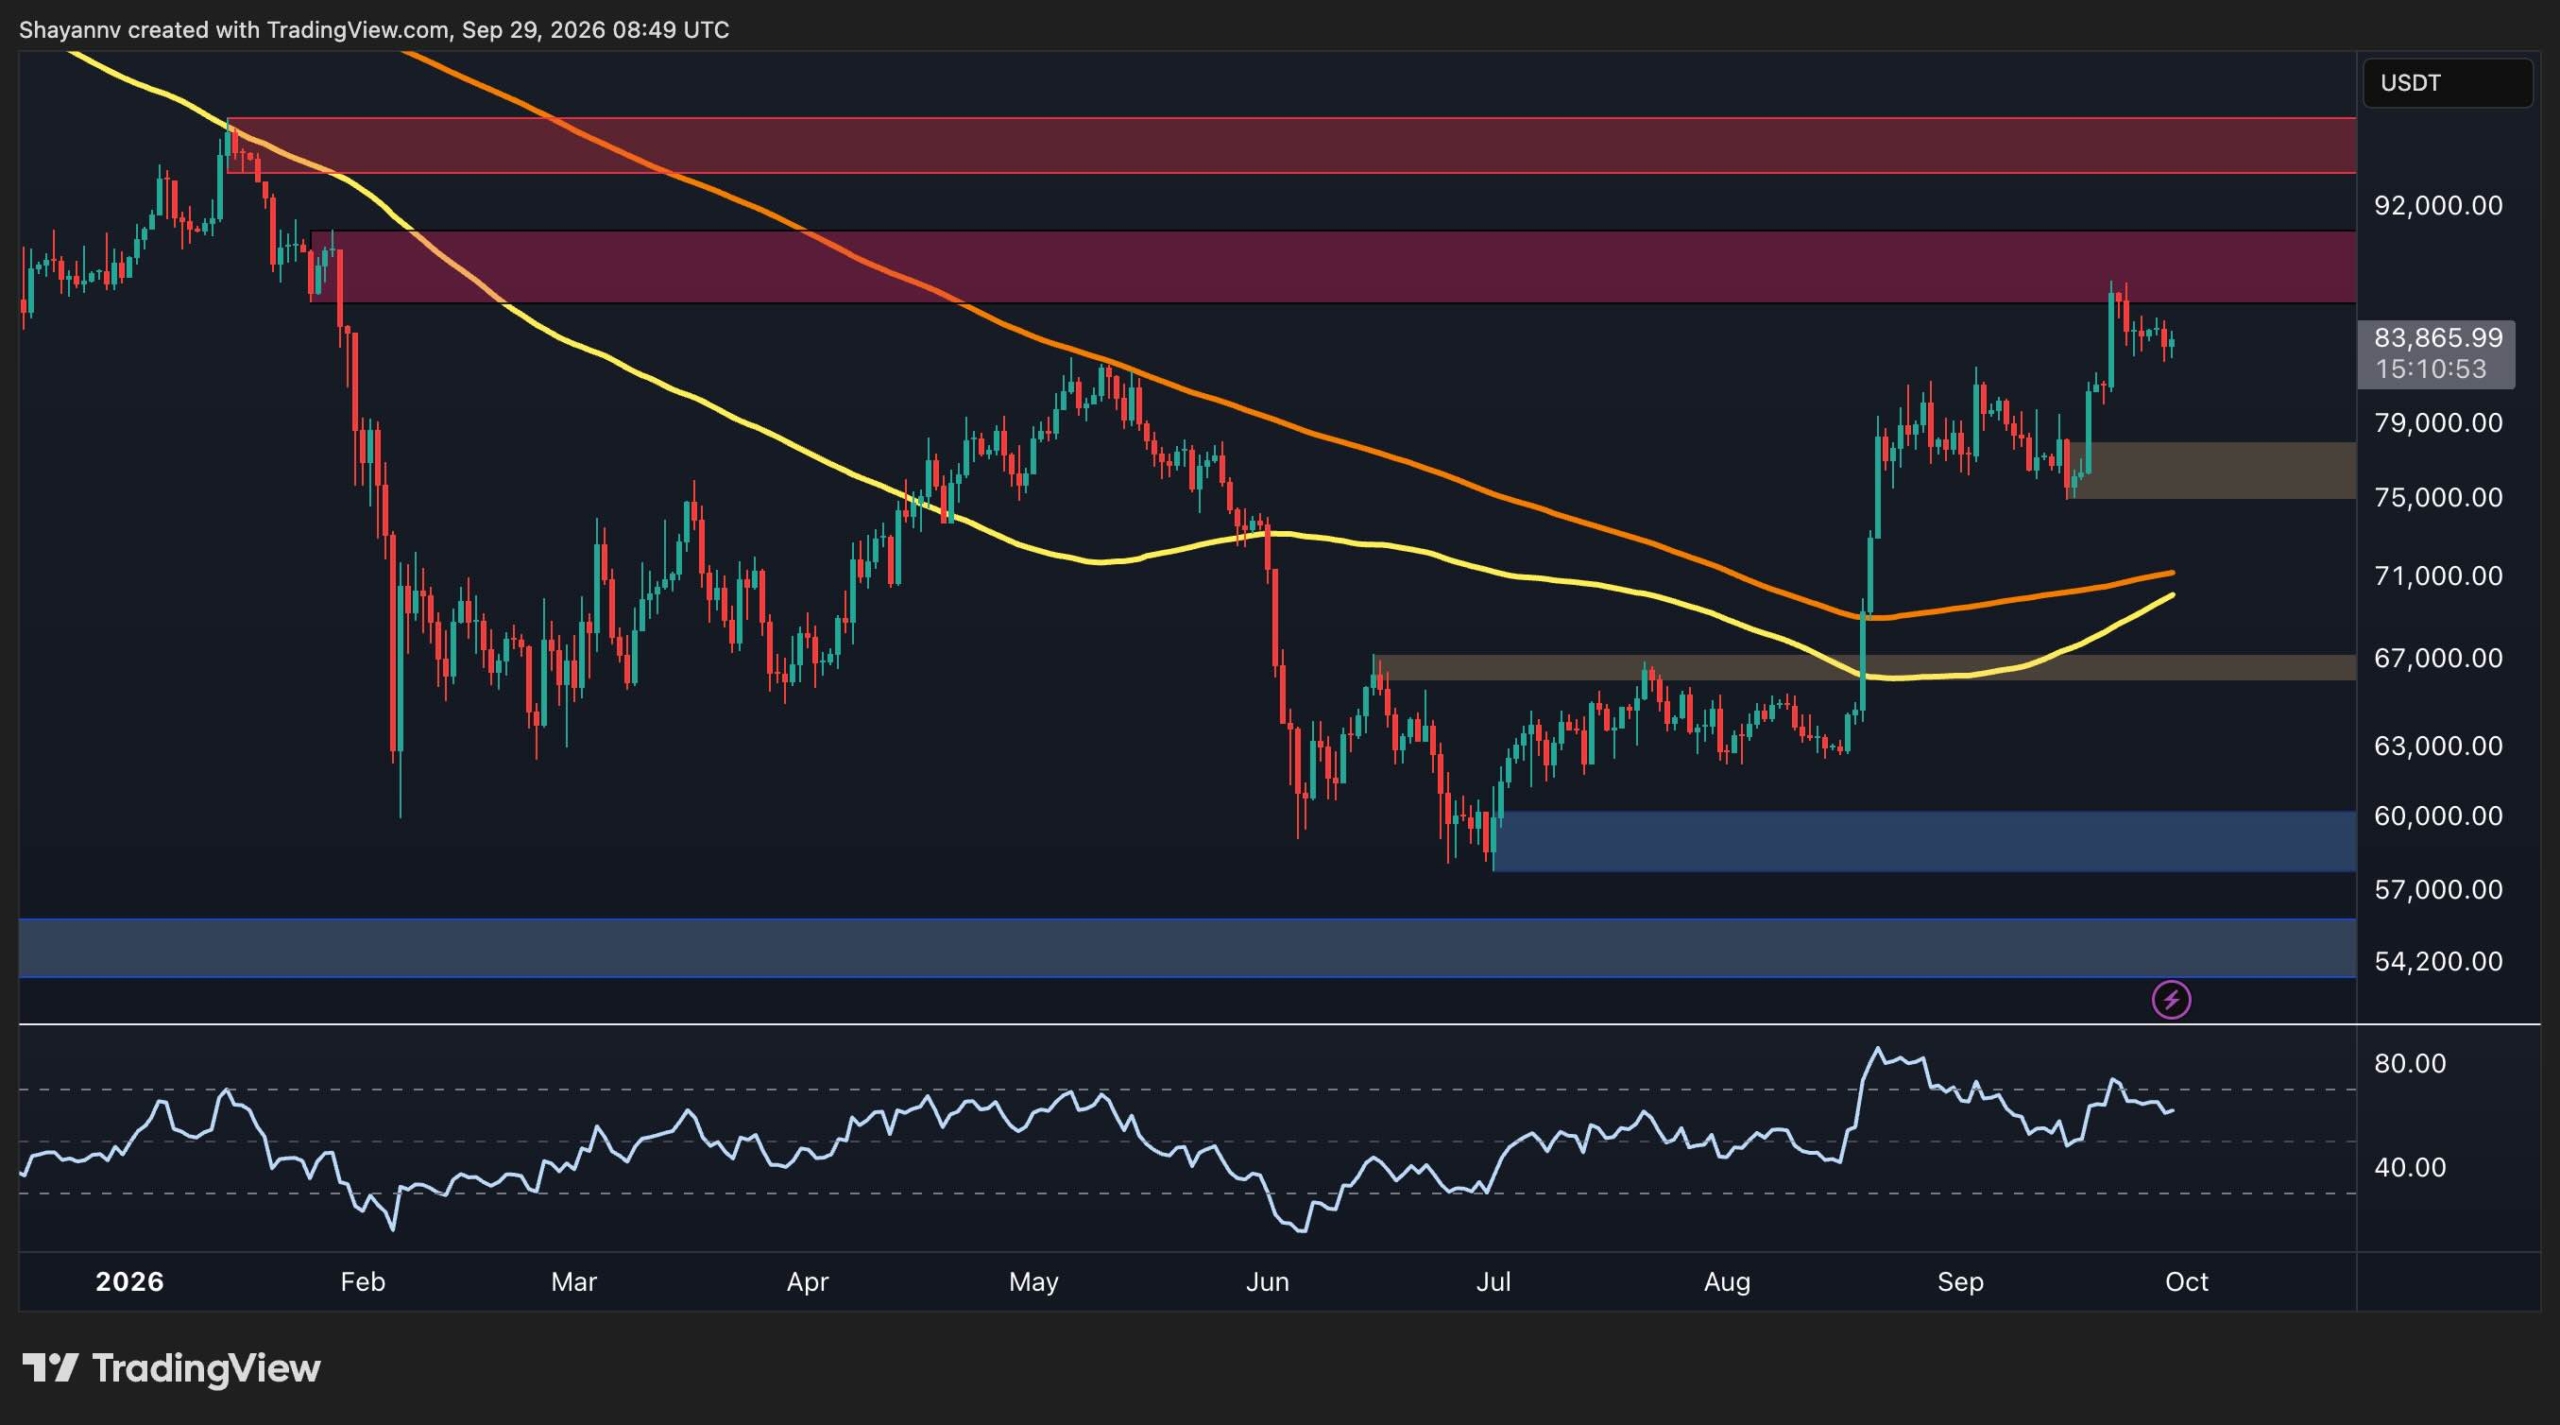
Bitcoin is trading around $84K following a recovery from the $60K area over the past couple of months. The cryptocurrency has moved back above its major moving averages, with technical indicators showing a constructive near-term structure.
Daily Chart Analysis
The daily timeframe shows a significant structural recovery from the $60K demand zone. Bitcoin reclaimed the $67K resistance level and broke higher in August, moving above both the 100-day and 200-day moving averages.
The 200-day moving average is currently around $71K, while the 100-day moving average is near $70K. Both averages are below the current market price and turning higher, with a potential bullish crossover keeping the broader structure constructive. The previous $67K resistance has shifted into an important support area.
Following the August breakout, Bitcoin consolidated in the $75K-$80K range before moving toward the $88K region. This $75K-$80K area represents the nearest major daily support, while $67K provides deeper structural support.
The main obstacle to further gains is overhead supply. The first major resistance zone sits at roughly $88K-$90K, followed by a higher supply area around $95K. Bitcoin would need to reclaim these zones to extend the recovery beyond $100K.
Shorter Timeframe Consolidation
On the 4-hour chart, Bitcoin made a sharp move from $75K through $82K and accelerated toward the $86K resistance level, where it faced rejection. Price has since consolidated near $83K.
The bullish order block near $80K-$82K serves as the key near-term demand area. The $86K-$90K region represents the immediate supply zone, with the price having already tested and failed to break above this area.
The 4-hour RSI is around 50 after recovering from lower levels, suggesting that short-term momentum has stabilized. A sustained move above $86K would target the upper part of the supply zone, while a breakdown below $80K could lead to a deeper retracement toward $75K.
On-Chain Profitability Improves
Adjusted SOPR, a metric measuring whether coins being spent are moved at a profit or loss, has climbed back above the 1.0 level. Values above 1 indicate that profitable spending is dominating.
The metric's 30-day exponential moving average is currently around 1.01 after spending much of the year below 1. This recovery coincides with Bitcoin's move from roughly $60K to the current $84K level, supporting the idea that the recent price recovery is accompanied by improving realized profitability.
However, the current reading remains only modestly above 1 and has not reached the significantly higher levels seen during previous strong advances. The improving on-chain data suggests better market conditions and reduces near-term panic-selling concerns, though it does not by itself confirm another major expansion in the trend.