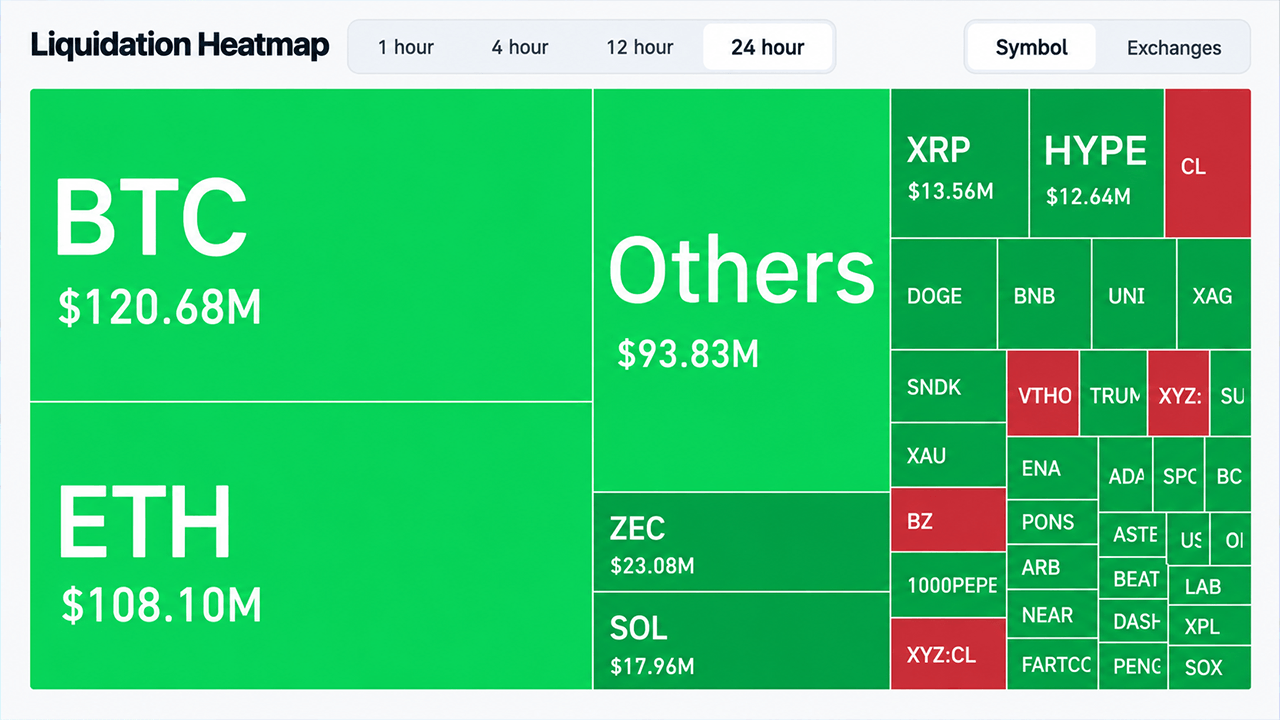
Bitcoin declined 1.22% today to $77,323, retreating from last week's push above $80,000 as risk assets across markets sold off following stronger-than-expected August Producer Price Index data.
The decline reflects broader market weakness, with the S&P 500 dropping 0.59% and the Nasdaq falling nearly 1%. Inflation concerns have also driven Treasury yields to multi-year highs and pushed oil above $100 a barrel amid U.S.-Iran tensions. Nearly 85% of the top 100 crypto assets by market cap declined over the 24-hour period.
Technical Setup Points to Potential Bullish Signal
Despite today's pullback, Bitcoin remains up sharply from August lows near $64,000. Technical indicators suggest the recent uptrend retains momentum, with the Average Directional Index at 45.8—well above the 25 threshold indicating a confirmed trend—and the Relative Strength Index at 55.6, in bullish territory without showing overbought conditions.
Bitcoin's 50-day exponential moving average is approaching a crossover with its 200-day moving average, a pattern known as a golden cross. This technical formation is projected to confirm in the next couple of days unless significant market deterioration occurs. It would mark the first golden cross since a bearish crossover in November 2025.
Institutional Demand Remains Strong
U.S. spot Bitcoin exchange-traded funds recorded $3.8 billion in net inflows over the past three weeks, their strongest stretch of 2026, with total net assets reaching $101.3 billion. This inflow pattern suggests institutional demand has not significantly slowed despite the recent pullback.
What's Ahead
The Squeeze Momentum Indicator is signaling volatility compression before a potentially larger move. Traders face multiple data points ahead, including Friday's Consumer Price Index report and the Federal Reserve's September 15 meeting, both of which could drive Bitcoin's near-term direction more than technical formations alone.