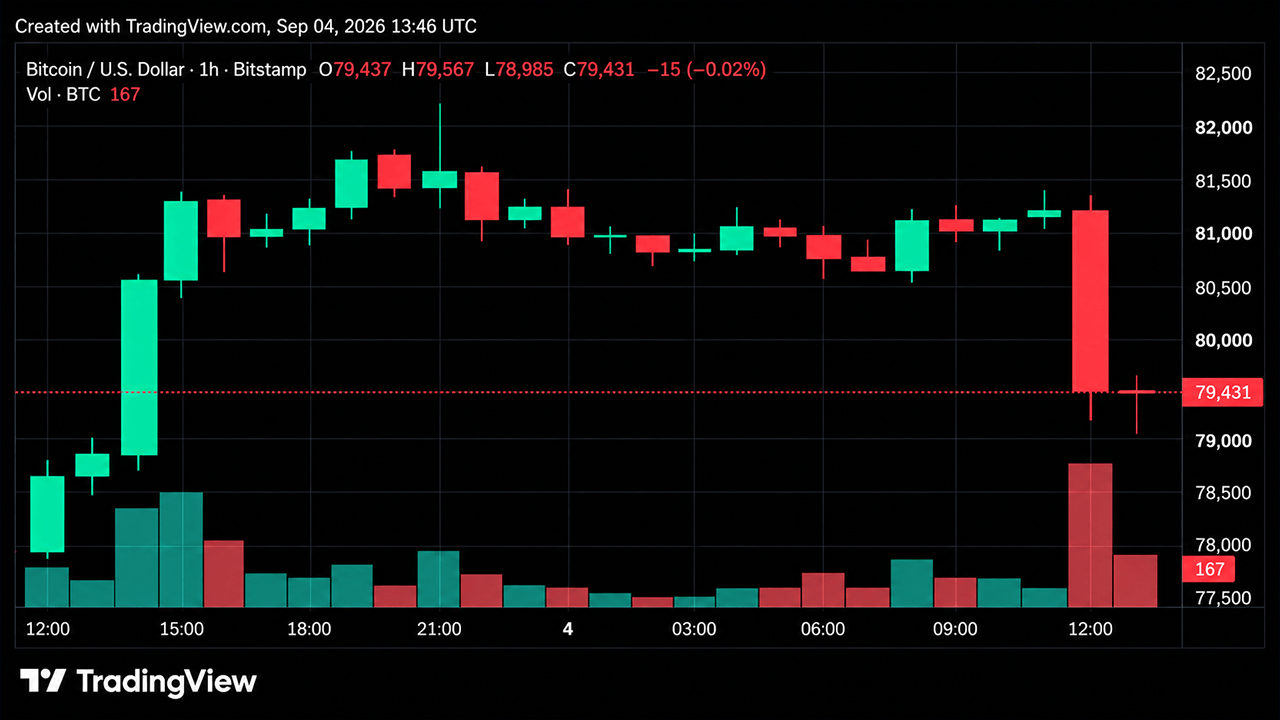
Bitcoin's price reversed sharply on September 4 after reaching $82,281, retreating into the $79,000 range as selling pressure mounted. The pullback has focused attention on whether support levels will hold amid mixed technical signals.
The 1-hour chart illustrated the abruptness of the reversal, with bitcoin climbing steadily before a large red candle drove the price down to cluster around $79,000. Trading oscillated between roughly $78,990 and $79,230, with volume during the decline exceeding typical levels from the prior session. The $78,500-$79,200 range emerged as a significant short-term support area.
Four-Hour and Daily Perspectives Diverge
The 4-hour chart revealed a failed extension, showing a single impulse from the mid-$76,000s to $82,281 followed by a high-volume reversal. However, this rejection has not yet translated into a confirmed break of the daily trend based on moving-average analysis.
The daily chart presents a stronger picture despite Friday's retreat. Bitcoin remained above the September 2 close near $77,300 and maintained its position above the daily moving-average stack, even as the session produced a lower high compared to the $82,281 spike.
Technical Indicators Show Caution
Daily oscillators displayed weaker enthusiasm than the moving averages. The relative strength index stood at 66, Stochastic at 73, and the commodity channel index at 71, all rated neutral. Momentum and moving average convergence divergence registered bearish readings, yielding two negative signals, nine neutral readings, and no bullish oscillator signals overall.
In contrast, the moving average tape remained firmly buy-biased, with 14 of 15 daily moving-average readings rated bullish. Bitcoin traded above every listed exponential and simple moving average but sat just below the 9-period hull moving average at $79,420.
Key Levels Ahead
Resistance includes the Fibonacci first resistance level at $81,430 and the Camarilla second resistance level at $82,098. A daily close above these levels would continue the September 3 breakout, while a close below $76,800-$77,300 would jeopardize that move and bring the $74,081 daily pivot into view.
At the time of reporting, bitcoin was trading at $79,339 per coin.