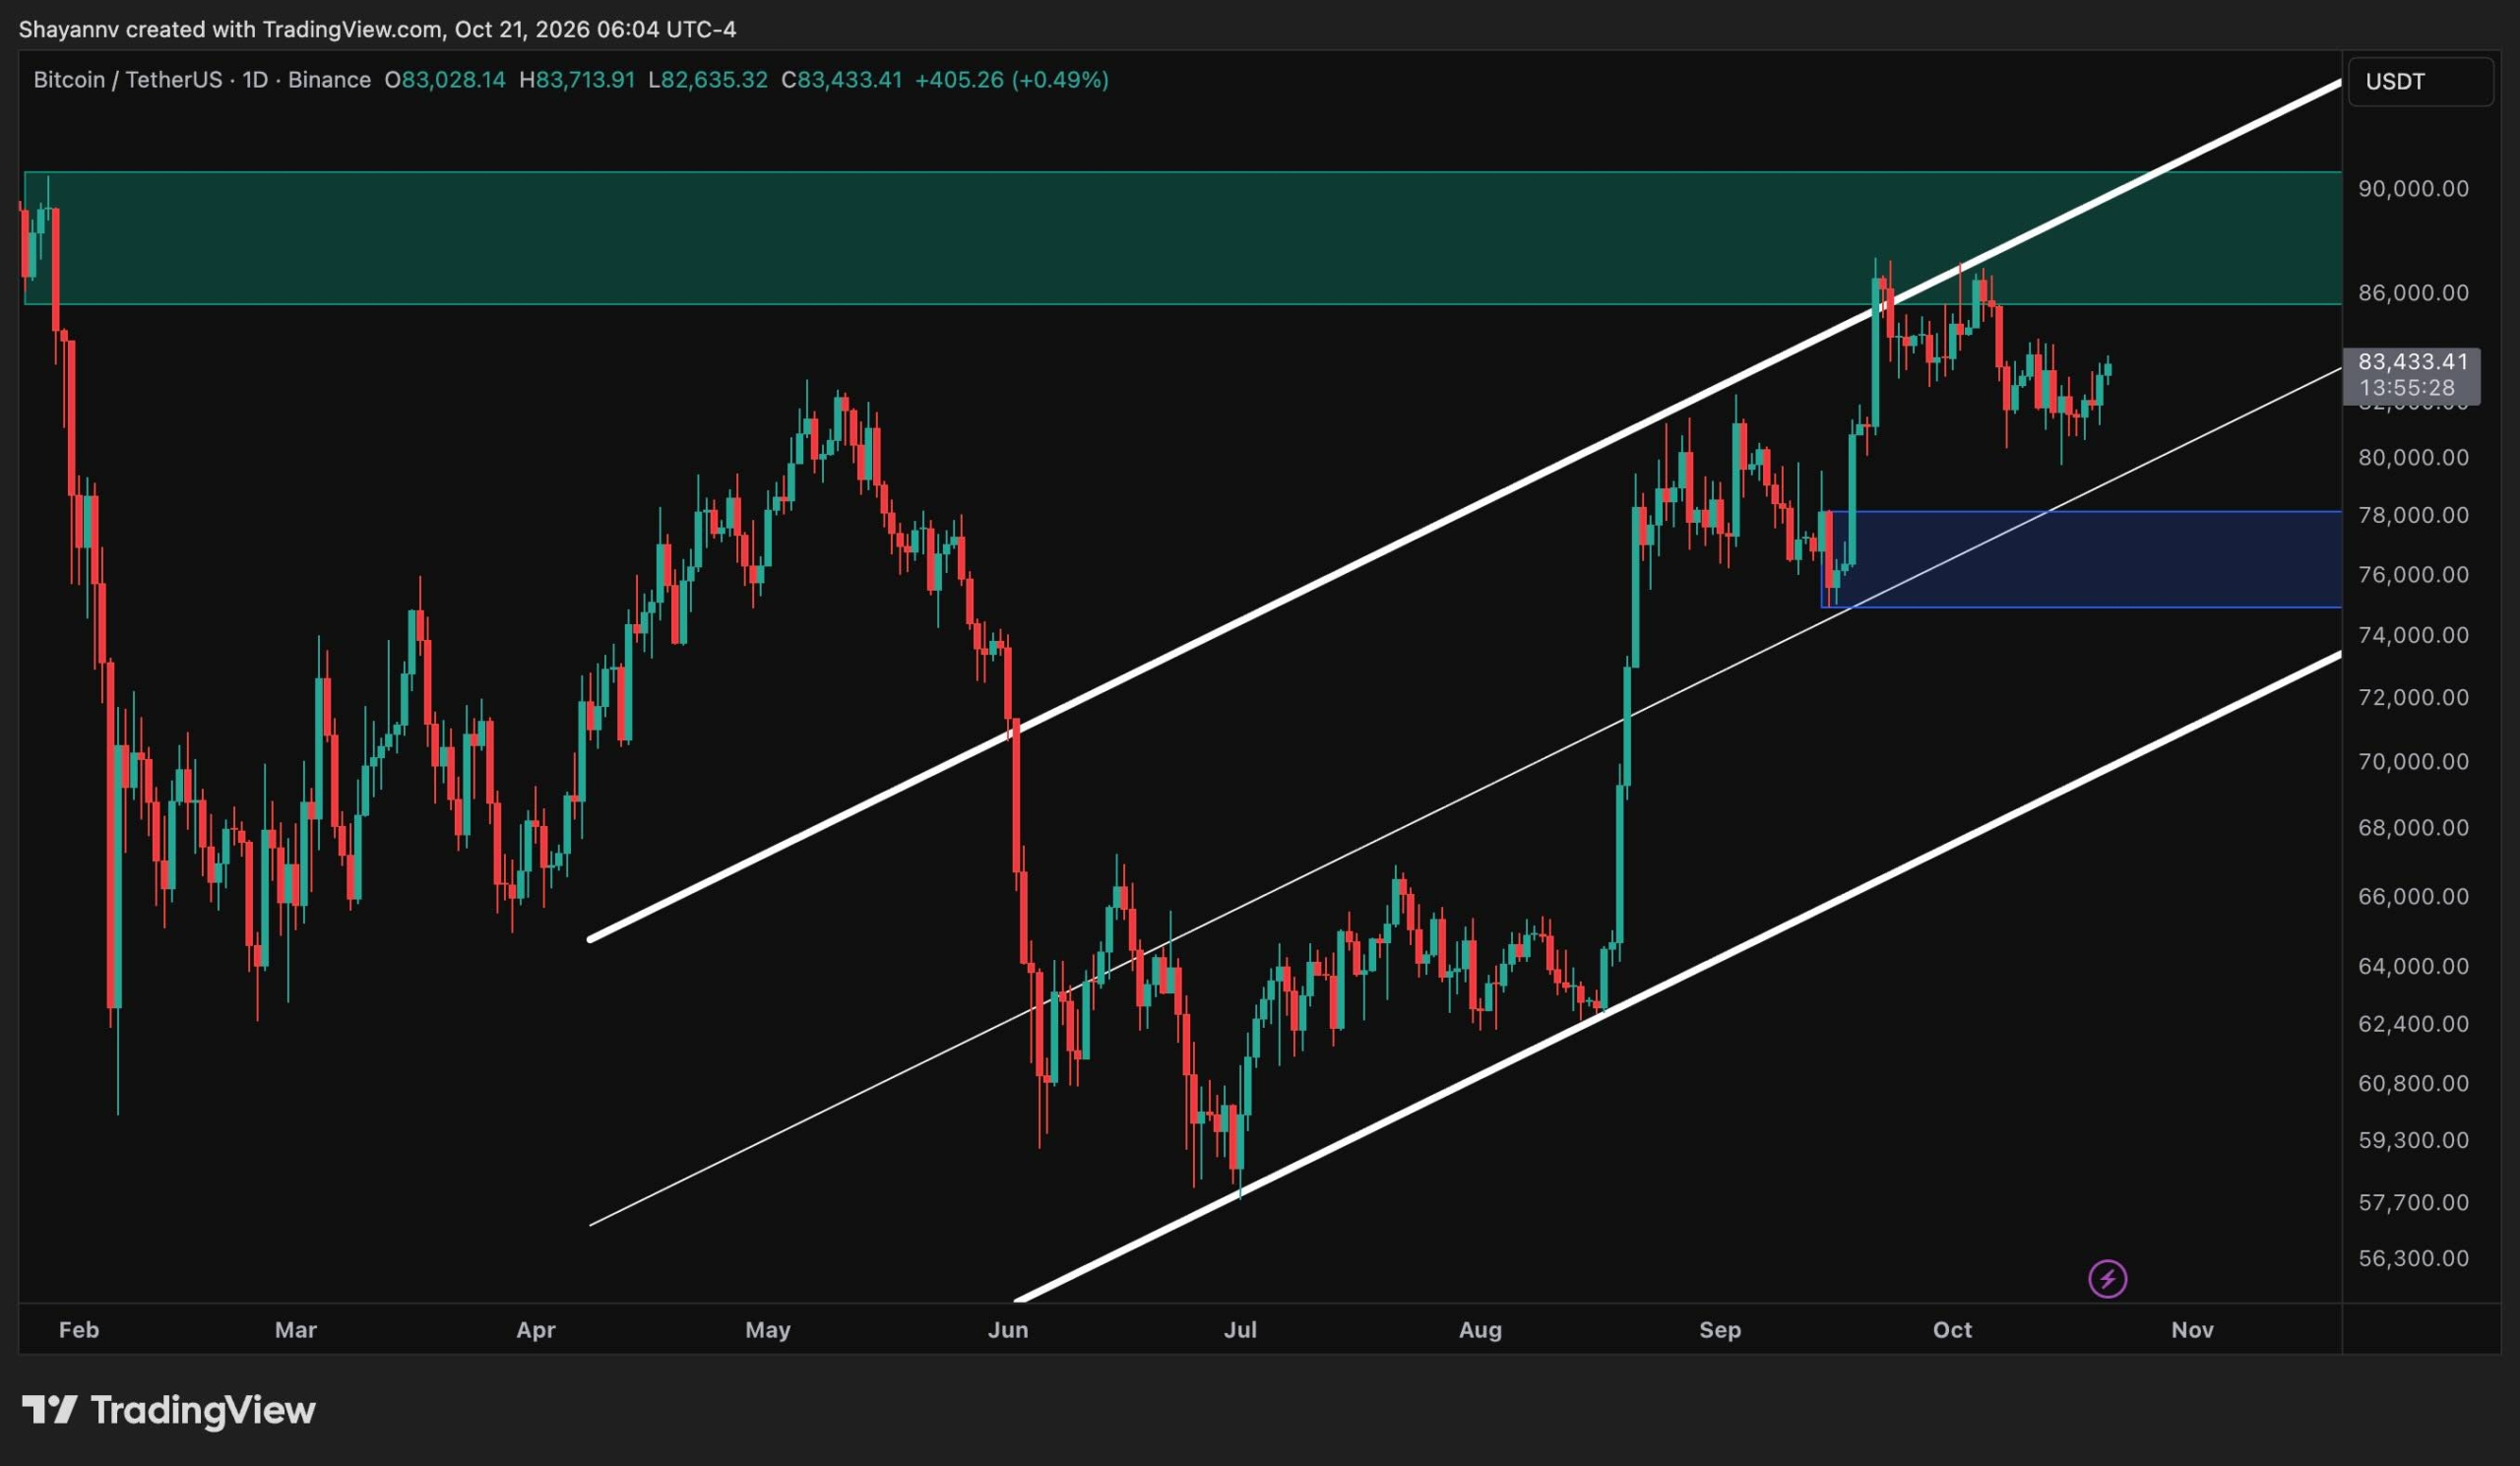
Bitcoin price action is offering mixed signals after hitting $80,000, with traders divided on the market's trajectory following a recent 25% rebound. Relative strength index (RSI) data across daily, weekly, and two-month time frames has contributed to debate over whether the recent price movement will endure.
RSI is a classic indicator used to determine trend momentum based on an asset's average gains and losses over a given lookback window. Bullish divergences, where the RSI makes higher highs while the BTC/USD pair makes lower lows, have historically accompanied major trend inflections.
According to TradingView data, a weekly bullish divergence pattern emerged throughout 2026, echoing a similar pattern seen in mid-2022 approximately six months before the end of that bear market. Jamie Coutts, chief crypto analyst at Real Vision, noted that the weekly timeframe is where the secular trend and cycle inflection points are read, describing weekly bullish divergences as having real weight.
The weekly RSI currently measures 58.3, marking its highest level since BTC/USD reached $126,200 in October 2025. Meanwhile, daily RSI readings reached 82.93, entering overbought territory for the highest levels seen since November 2024.
Market participants remain split regarding the daily readings. Some analysts view the overbought levels as a warning sign of an imminent reversal, while others note that historical Bitcoin uptrends have frequently featured multiple overbought periods above 70.
Jonatan Randin, senior market analyst at PrimeXBT, also highlighted similarities to late 2022, pointing out that daily RSI increased from 40 to 90 over a single weekly candle at that time. Randin stated that such extreme moves typically signal the start of a new phase in the cycle rather than necessarily confirming the end of a bear market.
Additionally, the two-month stochastic RSI indicator has printed an anticipated crossover of its two constituent trend lines, which acts as a cue for a bullish trend change. The indicator reached 4.81, avoiding the macro lows near zero that preceded previous historical crossovers.