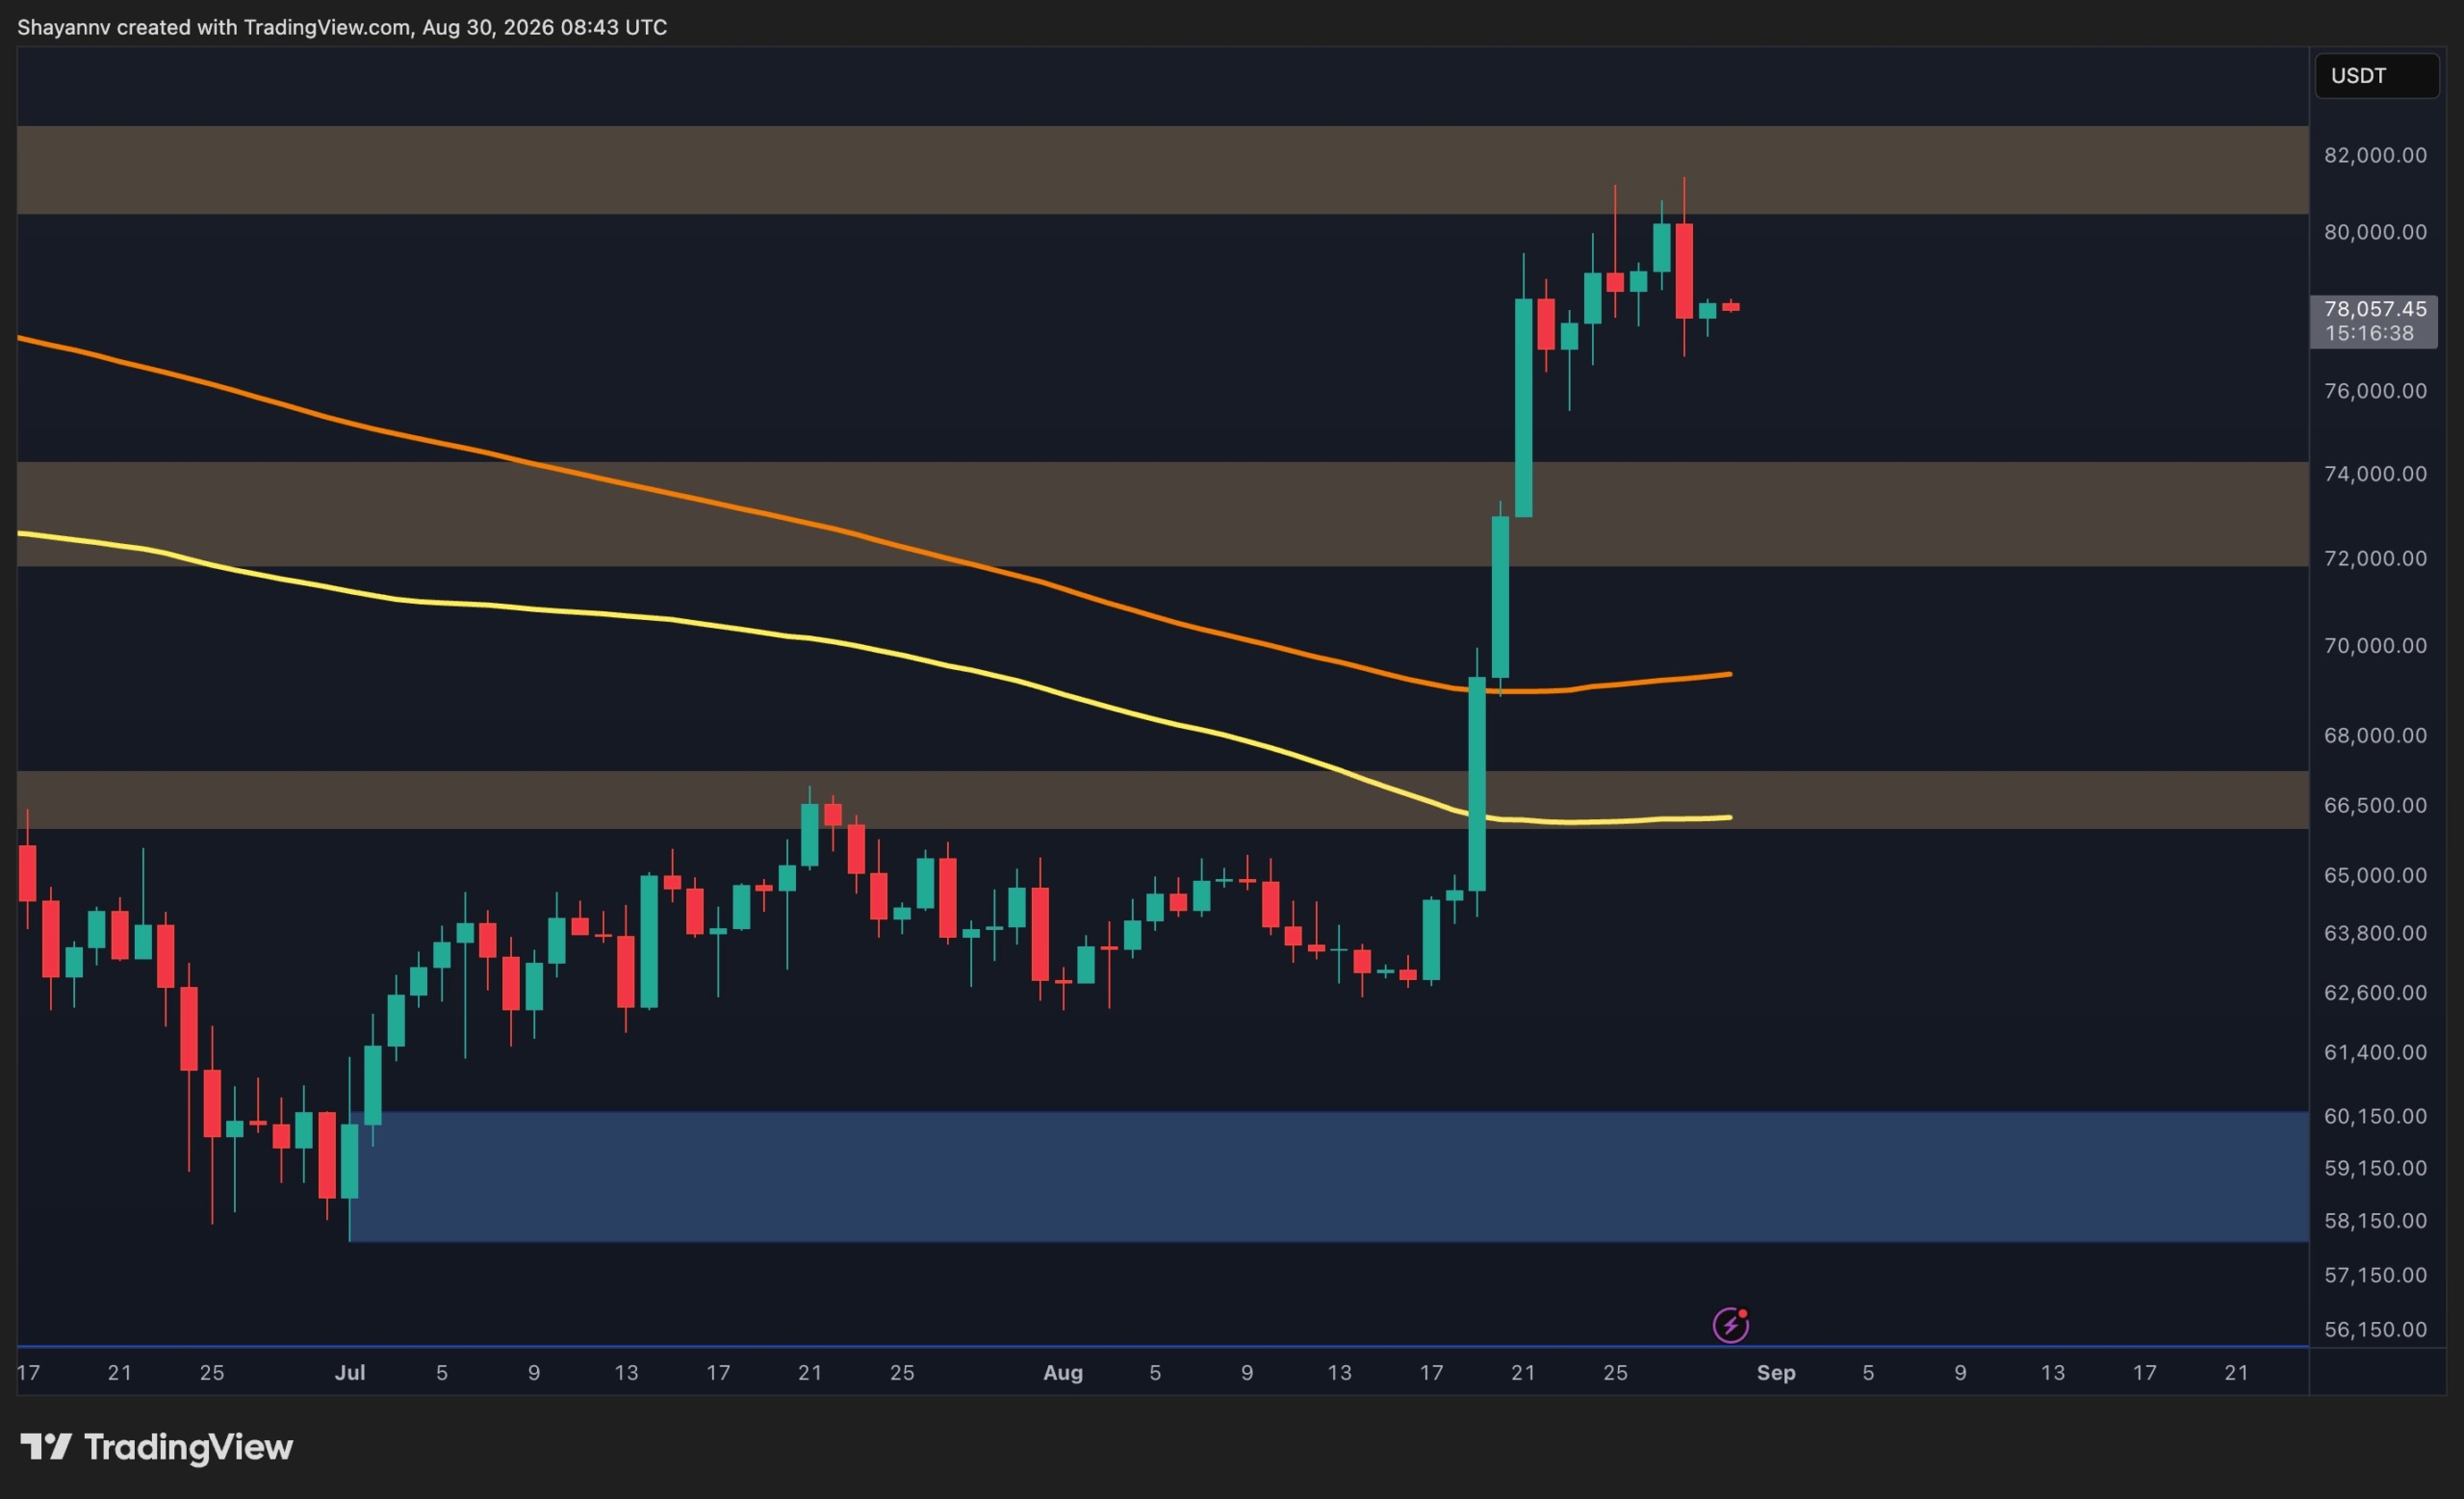
Bitcoin's rally has lost steam after reaching the $80,000 region, with technical indicators suggesting the cryptocurrency may enter a period of sideways, volatile trading rather than continue its powerful breakout.
The digital asset surged from the $64,000–$65,000 zone, clearing major resistance levels at $65,900–$67,100 and $72,000–$74,400. However, momentum weakened when Bitcoin approached the $80,500–$82,500 supply zone, where it has struggled to push higher. Bitcoin is currently hovering above $78,000.
Technical Outlook
On the daily chart, Bitcoin's structure remains fundamentally stronger following the initial breakout above key moving averages. However, the immediate trend appears more neutral. If weakness continues, Bitcoin could trade sideways between the $72,000–$74,400 support level and $80,500–$82,500 resistance.
A decisive break above $82,500 would signal continued bullish momentum, while losing the $72,000–$74,400 support would indicate a more significant deterioration in the post-breakout structure.
The 4-hour timeframe shows sharper signs of fading momentum. Bitcoin formed a rising channel beneath the $80,000–$82,000 resistance area before breaking below the channel's lower boundary. However, the asset has stabilized around $77,000–$78,000 without accelerating lower, suggesting consolidation rather than a sharp correction.
Futures Activity and Conviction
Futures market data indicates weak conviction among major participants. Bitcoin Futures Average Order Size readings show predominantly normal-sized orders, with no sustained cluster of large whale activity. This suggests major futures participants are not displaying strong directional conviction at current price levels.
Combined with hesitation visible in spot price action, the lack of notable large futures orders indicates participation is insufficient to support another highly impulsive move. Neither aggressive demand nor overwhelming supply appears to dominate the market.