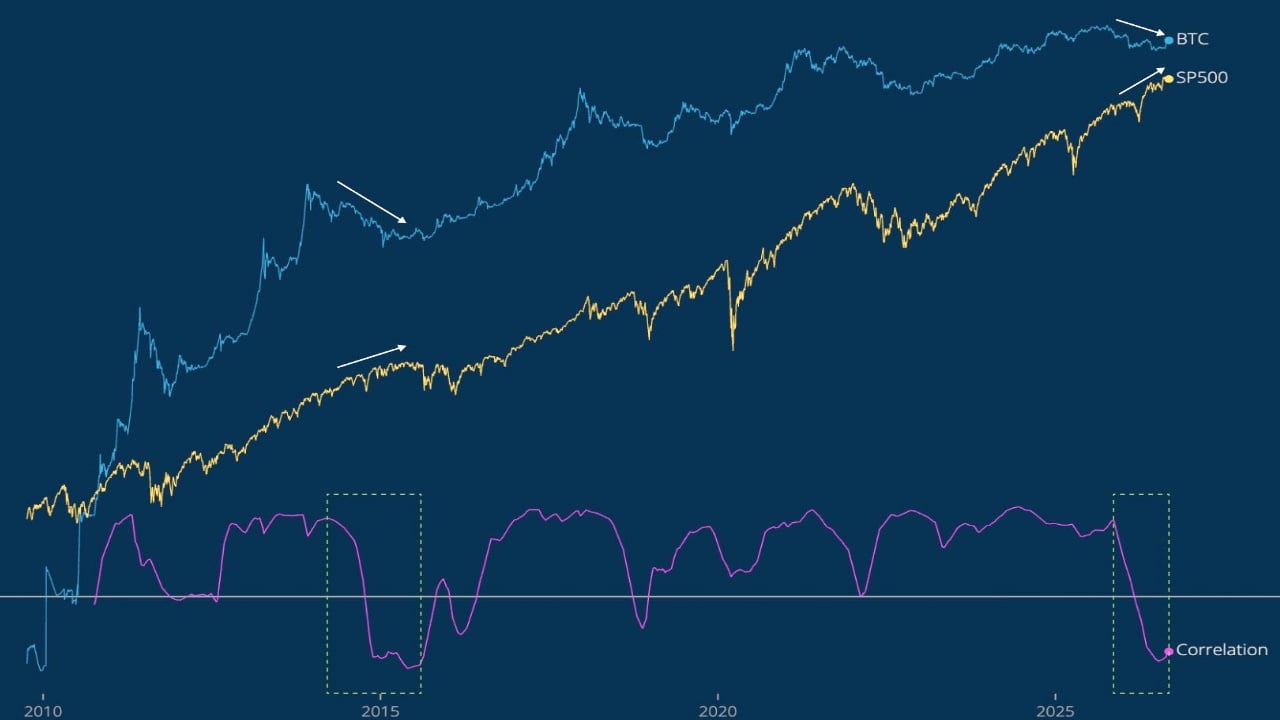
Bitcoin market analyst Willy Woo has identified what he characterizes as bitcoin's widest divergence from stocks in nearly a decade, drawing a comparison to 2015—a period he views as a precursor to the 2017 bull market.
In his analysis, Woo described 2014 as a year when stocks remained bullish while bitcoin experienced an uncorrelated bear market. He then characterized 2015 and 2016 as a contrasting phase in which Bitcoin engaged in "bull mode" while equities declined, before both markets aligned in 2017. Woo suggested the current setup mirrors this earlier pattern, noting that "BTC liquidity continues to strengthen, while equities starting to show signs of fragility."
Analyst Challenges the Decoupling Claim
The interpretation drew pushback from Cryptoquant contributor Darkfost, who presented a separate correlation analysis spanning January 2020 through July 2026. Unlike Woo's chart, Darkfost's data showed the latest correlation reading remained in positive territory, with the correlation coefficient repeatedly moving between positive and negative levels rather than entering a prolonged separation.
Calculation Methods Shape Conclusions
The disagreement highlights a critical distinction in financial analysis: correlation measures change based on the selected timeframe, data frequency, and how nontrading days are treated. Woo's chart uses Glassnode data but does not display its specific calculation settings. Darkfost questioned whether a high timeframe average could produce such a dramatic decoupling signal.
Earlier measurements illustrate the impact of chosen windows. Bloomberg Intelligence senior commodity strategist Mike McGlone cited a 200-day bitcoin-equity correlation near 0.5 on April 12, representing a moderately positive relationship over that longer period. Shorter calculation periods may produce different results by excluding months of earlier co-movement.
Recent Market Indicators Support Broader Trends
Some market data align with Woo's concerns about equity vulnerability. Grayscale recently cited record U.S. household equity exposure and elevated stock valuations, noting that concentrated portfolios could become vulnerable to an equity-market reversal.
Other correlation measures show bitcoin moving away from technology stocks while drawing closer to gold. Bitwise data showed bitcoin's 90-day correlation with gold moving above 0.5, while Glassnode data indicated bitcoin's 30-day correlation with the S&P 500 falling toward zero during the August rally.
Bitcoin's market structure—including continuous global trading, a predetermined issuance schedule, and demand drivers that differ from corporate earnings—partly explains its capacity to move independently from equities. The network's fixed supply of approximately 21 million BTC also separates the asset from equity indexes, whose values depend on company profits, interest rates, valuations, and economic expectations.