Bitcoin has staged a sharp recovery from the lower end of its recent range, pushing back toward the $70,000 level after spending several weeks consolidating below a descending trendline. The latest move has improved the short-term market structure considerably as BTC approaches a notable resistance cluster.
Daily Chart Analysis
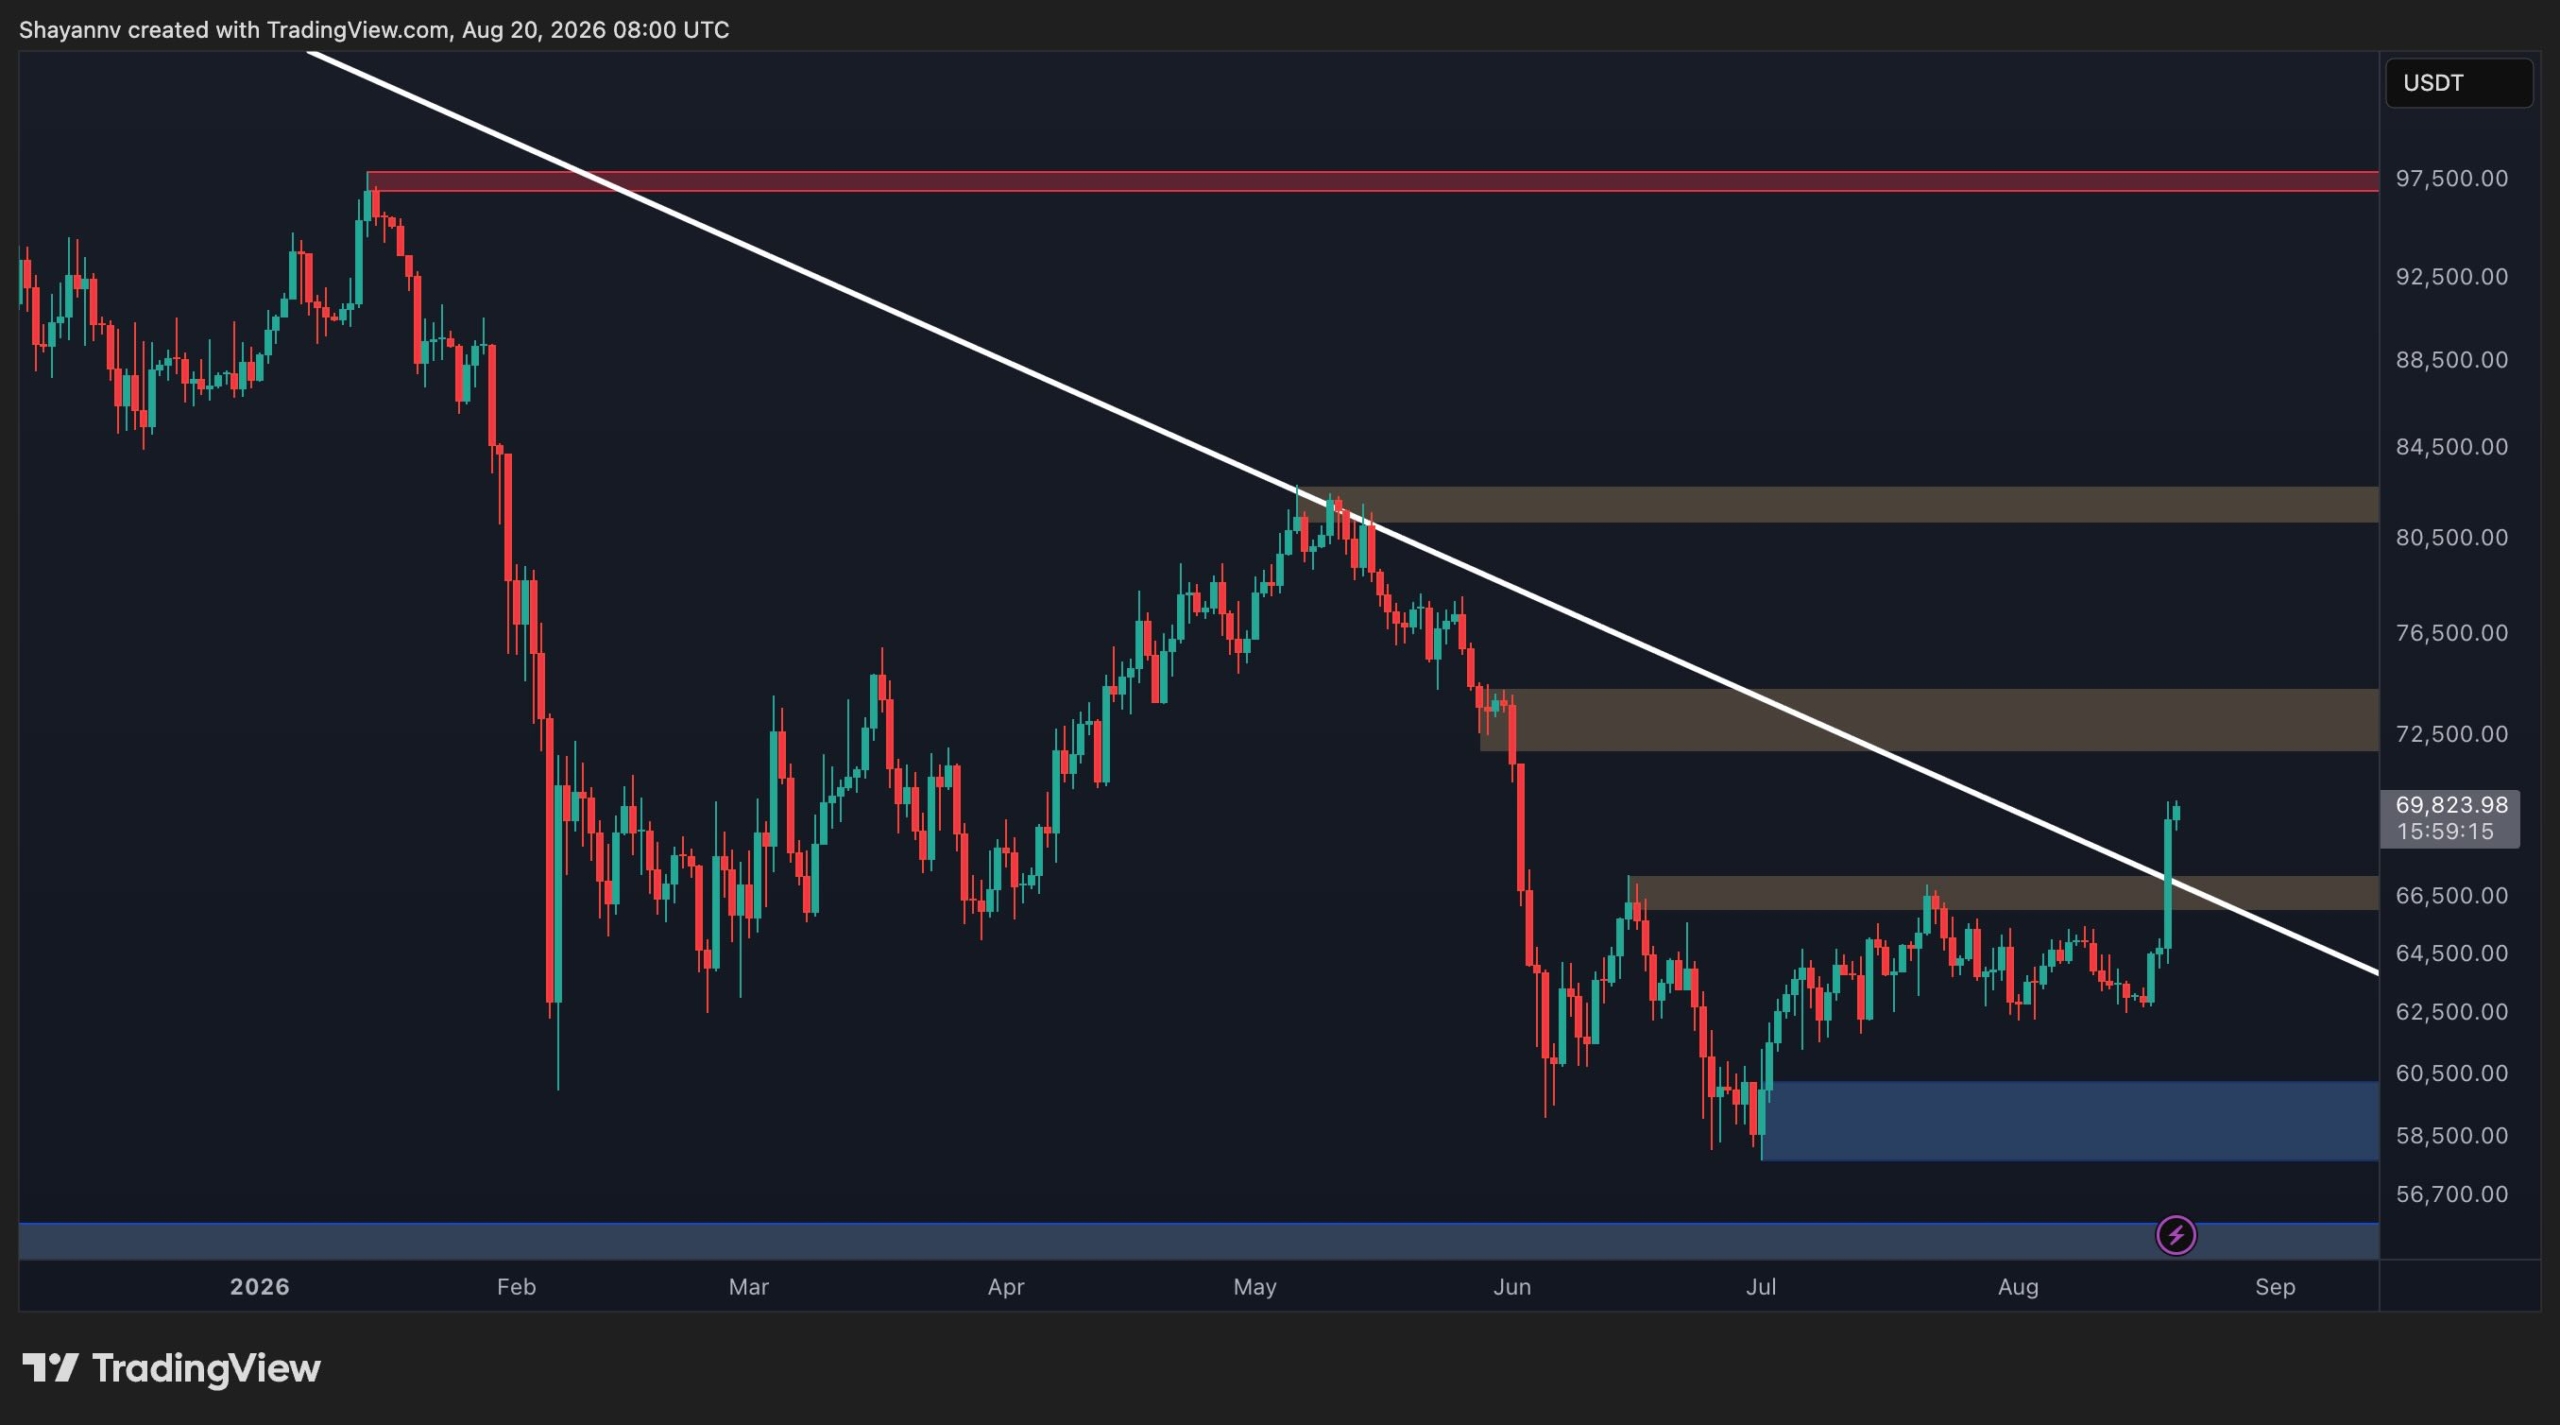
On the daily chart, Bitcoin recovered from the $60,000 support area following a prolonged decline from all-time highs. Previously, the market formed a broad consolidation structure, repeatedly finding buyers around the $60,000 to $62,000 region while rallies were capped by a descending trendline.
The latest development features a decisive breakout above the long-term descending trendline and the $66,500 resistance zone, with the asset trading around $72,000. This marks a structural improvement because the trendline had contained recoveries for months. However, the asset is now testing the $72,000 to $74,000 resistance zone. A sustained move through this area could expose the $80,000 to $82,000 resistance region next.
On the downside, the former $66,500 resistance zone serves as the primary support area to monitor. A daily close below this region would weaken the breakout and raise the possibility of a return toward the $60,000 demand zone.
Short-Term 4-Hour Structure
The 4-hour chart highlights a contracting structure that persisted from July into mid-August, featuring a descending upper trendline and a rising lower boundary. The subsequent breakout drove Bitcoin through the descending trendline and the $66,000 to $67,000 resistance zone in an aggressive advance from the mid-$64,000 area toward $70,000.
The $66,000 to $67,000 zone acts as a key short-term pivot. Maintaining prices above this level keeps the breakout structure intact. While momentum currently favors buyers, analysts note that a pullback toward $66,000 to $67,000 followed by a successful rebound could confirm that former resistance has transitioned into support.
On-Chain Futures Activity
Data from the futures average order size chart indicates that the recovery from $60,000 to $70,000 featured a mixture of normal and whale-sized orders. Green and light-green clusters appeared repeatedly during the advance, suggesting larger orders remained active during the upward move rather than the action being driven exclusively by smaller retail transactions.
While the indicator does not specify whether larger orders are predominantly long or short, the presence of renewed activity from larger futures participants offers additional context for the recent price action.