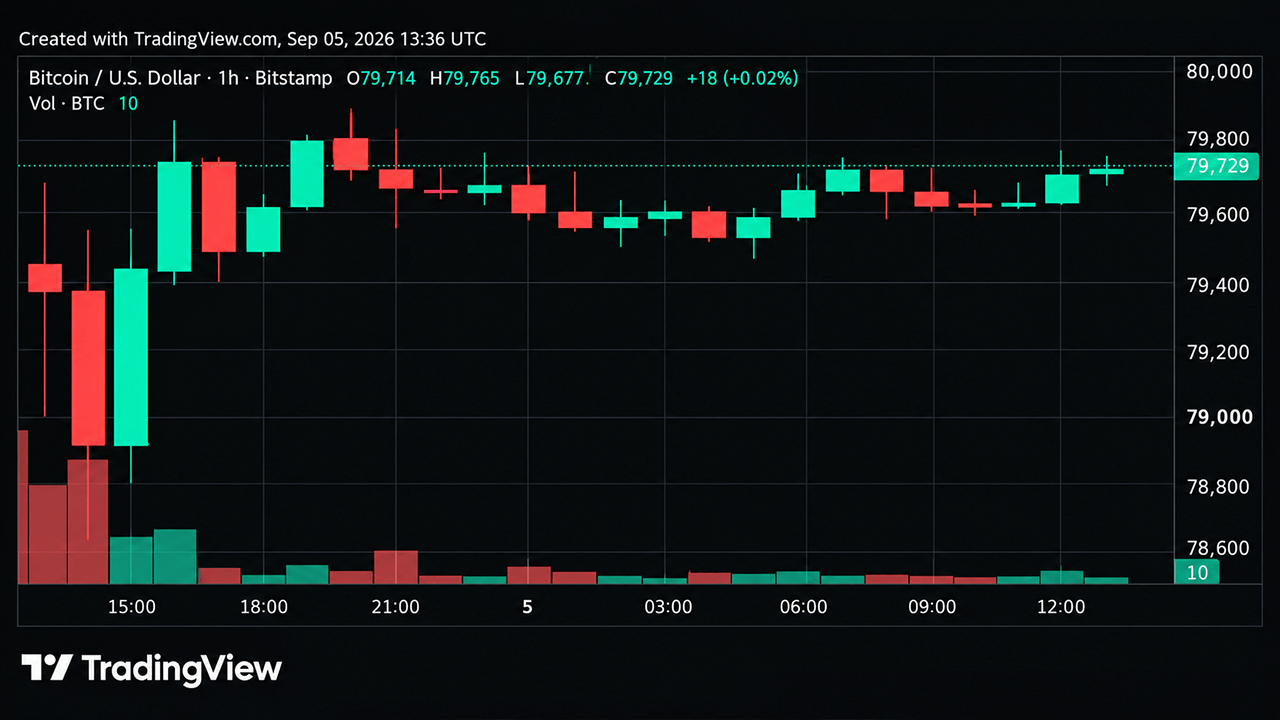
Bitcoin is trading above $79,700 per coin on Saturday as bulls and bears compete following a rejection from $82,281. The $78,500-$80,000 zone has emerged as a critical price range in this week's volatile market environment.
Bitcoin's price logged a 0.26% 24-hour gain at $79,715 and is moving within a rolling range of $78,706-$79,848. The market remains caught between a strong longer-term trend and short-term momentum that is losing steam.
Technical Analysis: Key Levels and Resistance
On the 1-hour chart, Bitcoin shifted from aggressive movement into a tighter consolidation after a large volume spike rejected the $82,281 level. Recovery attempts have stalled below $80,000, with candles tightening around the $79,500-$79,800 range. The $79,500 zone is critical, with bids thinning below that area and asks stacking from $80,000 into the low $82,000s.
The 4-hour chart reveals momentum cooling significantly. The rally from the high $77,000s to $82,000 faced a high-volume rejection that sent Bitcoin grinding back toward $79,500-$80,000. The 4-hour relative strength index (RSI) moved above 70 at the peak before cooling to the low 50s, representing a momentum reset rather than a completed trend reversal.
Bitcoin continues to trade above every listed simple moving average (SMA) and exponential moving average (EMA) from 10 through 200 periods on the daily chart. The $80,000 level acts as the first recovery hurdle, with resistance stacking around $81,250-$82,281 and then $82,800.
Oscillator Signals Show Neutral Momentum
Weekend oscillator readings present a mixed picture. The daily RSI reads 67, the Stochastic comes in at 71, the commodity channel index (CCI) sits at 63, and the average directional index (ADX) reads 46, each carrying neutral signals. However, momentum and MACD readings flash bearish signals, producing two negatives, nine neutrals, and zero positives across the oscillator board.
Moving average readings remain predominantly bullish, clocking 13 bullish signals against one neutral and one bearish signal. The 10-day EMA/SMA sits at $78,503/$78,798, while Bitcoin trades roughly 14% above the 200-day SMA, indicating significant trend strength.
Bullish and Bearish Scenarios
Bulls remain in control as long as Bitcoin holds the $78,500-$78,800 area. A reclaim of $80,000 would pick up momentum, while a daily close through $81,250-$82,281 would signal renewed continuation toward higher levels.
Bears need Bitcoin's price to lose $78,500 and put pressure on the $78,125 structural level. A 4-hour close below $78,500 would bring $76,000-$77,000 into play, though the strong moving-average stack presents significant headwinds for further downside.