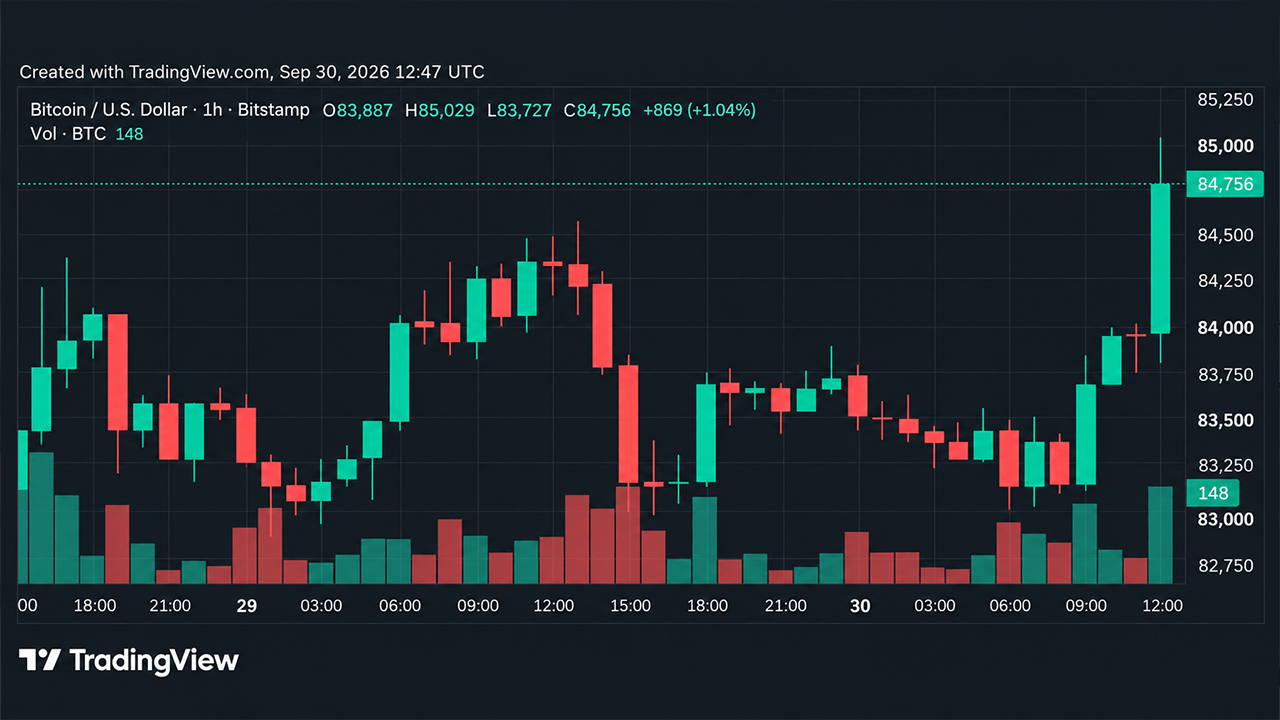
Bitcoin's price traded near $84,890 to $85,469 early Wednesday, up 0.4% over 24 hours, as the market continued working through a pullback from September's $87,374 peak. The surge followed the release of August's personal consumption expenditures (PCE) price index, which rose at a 3.4% annual rate, down from 3.7% the previous month.
The cryptocurrency has settled into a trading range with support clustered around $82,555 to $83,000 and resistance beginning at $85,500 and higher. The broader uptrend remains intact, though short-term momentum has become contested.
Technical Levels and Market Structure
On hourly charts, Bitcoin's rebound from the September 28 local low of $82,555 remained supported, with price holding just below $85,000 after a sharp retreat from $87,272 on September 23-24. The market spent several days trading between roughly $84,000 and $85,000 before slipping to the $82,555 floor.
The 4-hour chart revealed Bitcoin caught in a mildly descending range spanning approximately $82,500 to $85,500, following a powerful advance from $74,913 around September 16 to the $87,374 peak on September 22.
Bitcoin's daily chart remained constructive despite failing to hold the September high. The broader advance began from a late-June low of $57,735, worked through a July-August base, and eventually produced September's run into the upper $87,000s. BTC settled in the $83,000 to $85,000 neighborhood, remaining comfortably above the June-August range and the mid-$70,000 breakout zone.
Oscillators and Moving Averages
Daily oscillators presented a mixed picture, with readings showing one bearish, eight neutral, and two bullish signals. The relative strength index (RSI) stood at 61, while the Stochastic registered 69 and the commodity channel index (CCI) sat at 47, all neutral readings.
Moving averages provided clearer bullish support, with Bitcoin trading above its 10-, 20-, 30-, 50-, 100- and 200-period exponential moving averages. The cryptocurrency also sat above most simple moving averages, with only the 10-period SMA at $84,531 presenting a sell signal positioned directly within nearby resistance.
Key Price Scenarios
A sustained push through the $85,500 resistance ceiling could reopen a path toward $86,200 and the recent $87,374 high. Conversely, a loss of the $82,555 support level could expose the $81,000 to $82,000 support zone and potentially the mid-to-high $74,000 area.