Bitcoin could trade at an average price of $94,000 by the end of October 2026, according to a forecast that outlines three distinct scenarios for the cryptocurrency as traders anticipate the annual "Uptober" period.
The forecast assigns a 50% probability to Bitcoin trading between $90,000 and $98,000 by October 31. This base-case scenario reflects continued institutional accumulation, stable market sentiment, and Bitcoin's historical tendency to perform well in October.
The bearish scenario carries a 25% probability, projecting a decline toward the $75,000 to $82,000 range, potentially driven by profit-taking following recent gains and a slowdown in exchange-traded fund demand. Conversely, the bullish scenario also carries a 25% probability, with Bitcoin potentially reaching between $105,000 and $120,000, contingent on sustained ETF inflows, favorable macroeconomic conditions, and a breakout above key resistance levels.
Technical Levels and Support
According to the forecast, $90,000 represents the most important resistance level. A decisive breakout above this area could open the door to six-figure prices and increase the probability of the bullish scenario. On the downside, the $82,000 to $84,000 range serves as a key support zone. A sustained break below these levels could weaken momentum and increase the likelihood of a deeper correction.
Institutional Participation and Historical Patterns
October has historically been one of Bitcoin's strongest months, with past market cycles showing outsized gains during the period. The current setup differs from previous cycles due to increased institutional participation in price action.
Recent spot Bitcoin ETF inflows have reached their highest levels of 2026, helping support the asset near $85,000. Large institutional buyers have continued accumulating Bitcoin, reinforcing bullish sentiment heading into October.
Current Market Position
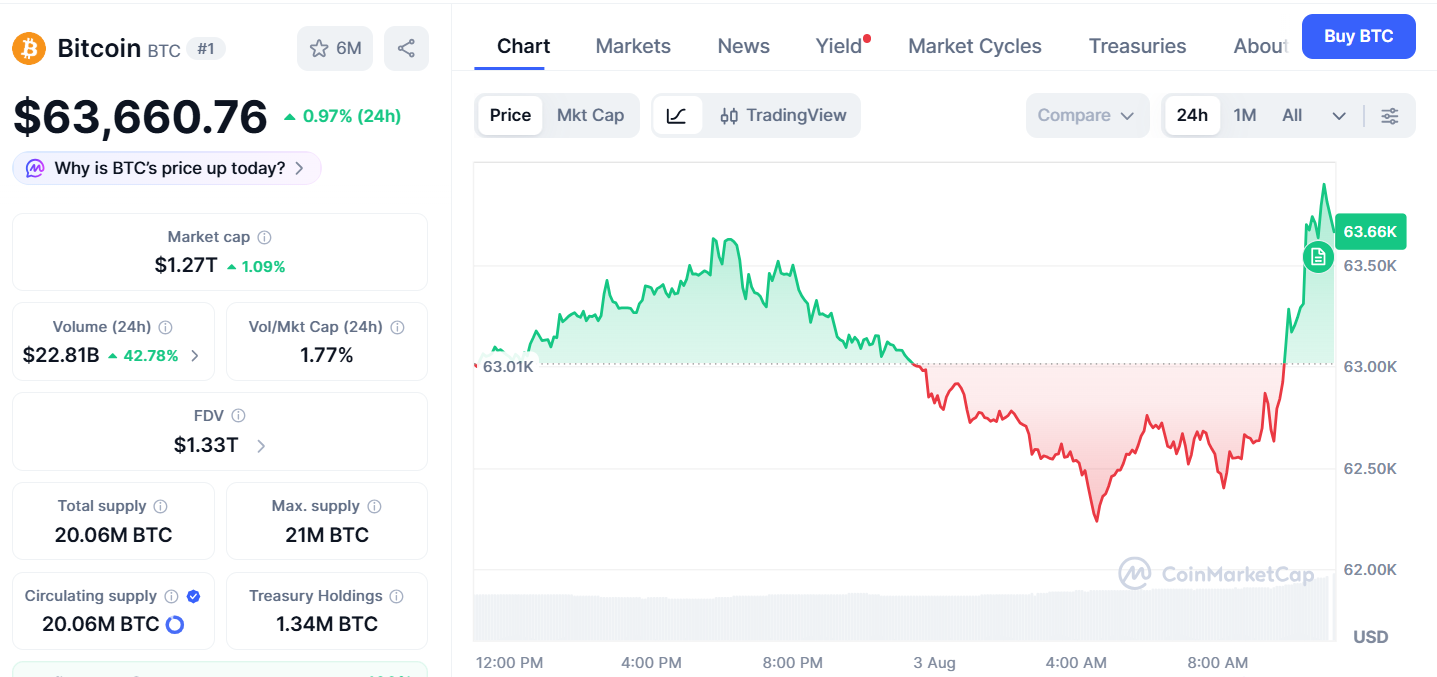
At the time of the forecast, Bitcoin was trading at $84,917, up approximately 1% in the past 24 hours and 5.5% over the preceding week. Bitcoin was trading well above its 50-day simple moving average of $75,728 and 200-day simple moving average of $71,032, indicating that both medium-term and long-term trends remain bullish. The 14-day relative strength index of 64.99 points to healthy buying momentum without entering overbought territory, leaving room for further upside.