The cryptocurrency and equity markets are displaying divergent technical patterns, with crypto assets showing broader strength relative to their long-term trends even as both face near-term headwinds.
According to data shared by analyst Scott Melker, 88 of the top 100 cryptocurrencies are currently trading above their 200-day moving averages. Bitcoin and Ethereum are among those assets, and most also hold above their 50-day and 100-day averages. By contrast, approximately 257 stocks in the S&P 500 are trading below their 200-day averages, meaning roughly 49% of the index trades above that widely watched technical measure.
Melker characterized the crypto configuration as "clean, bullish" from a technical standpoint, noting that while major tokens remain significantly below their all-time highs, their positioning relative to moving averages contrasts with equities that have climbed closer to record levels despite weak internal breadth.
Market Movements and Price Action
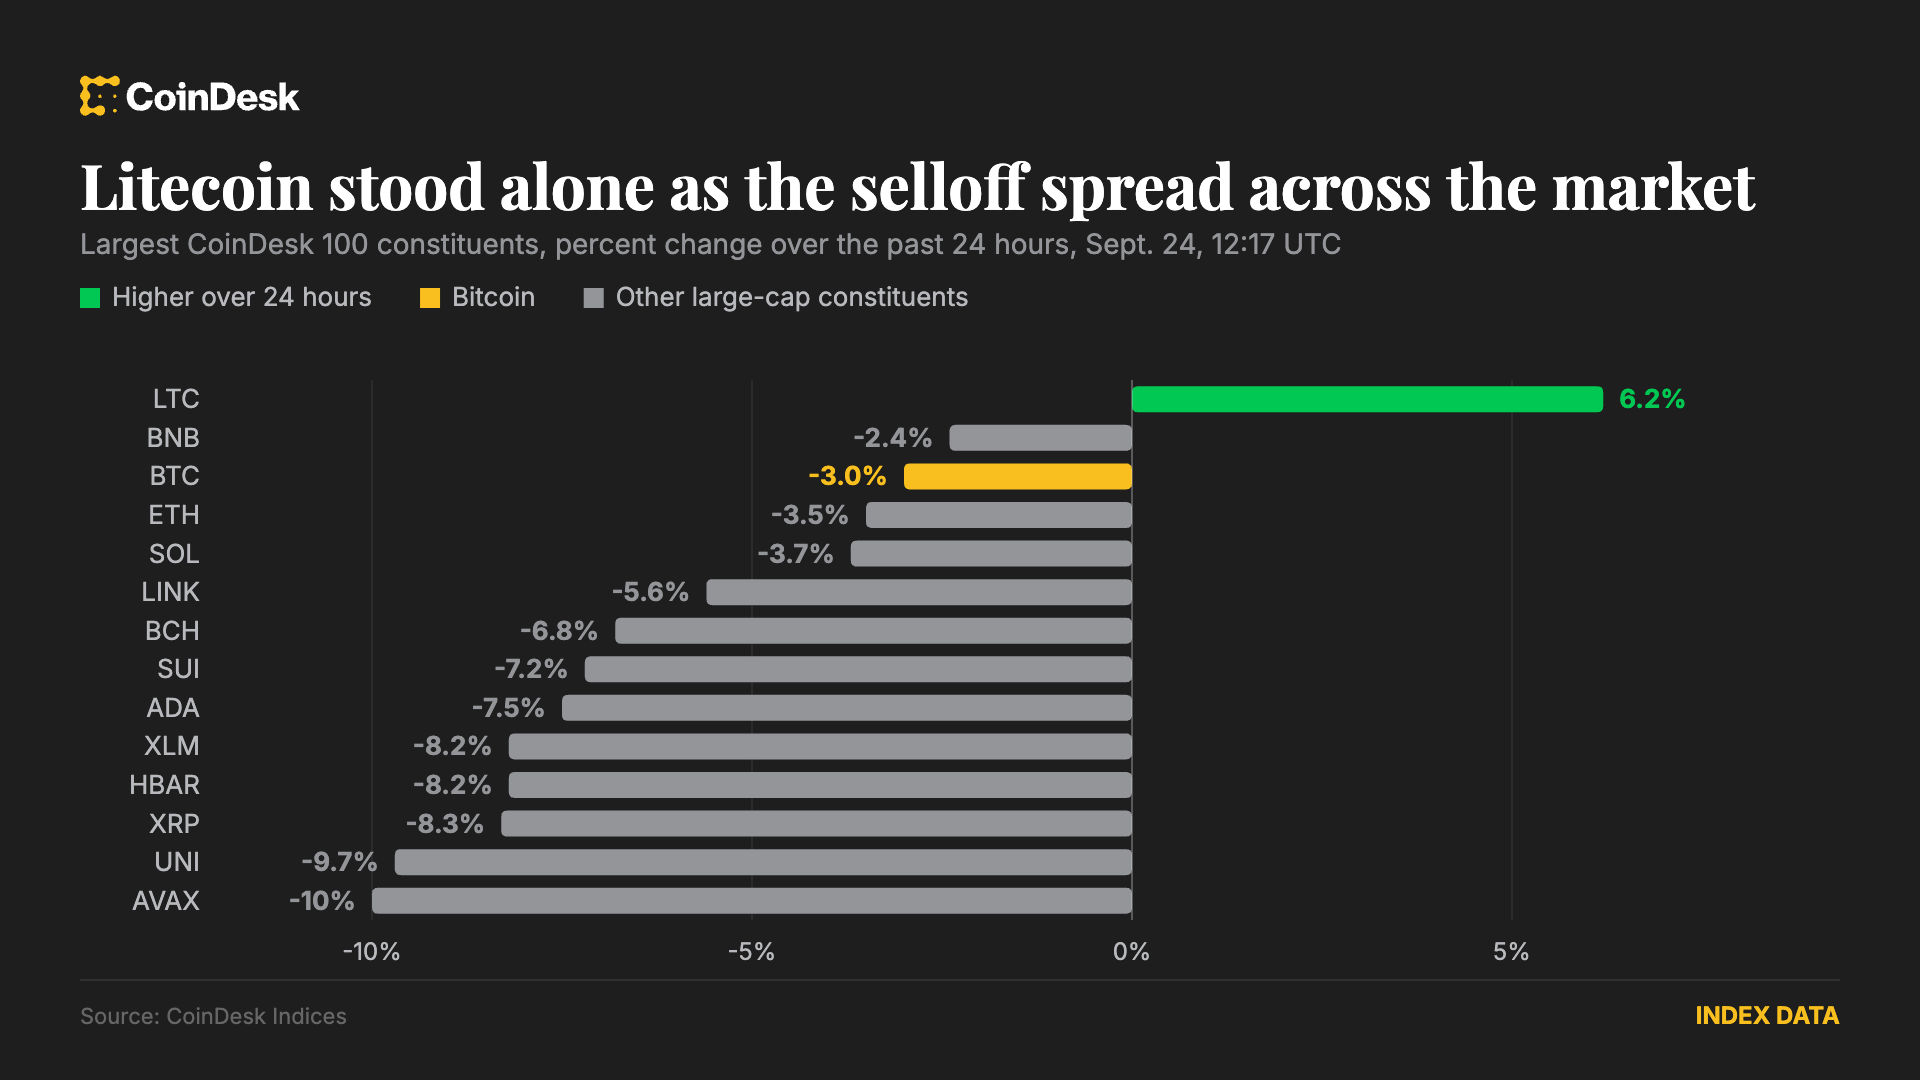
Bitcoin recently rebounded from around $75,000 following setbacks tied to the failed CLARITY Act vote and Federal Reserve interest rate increases. The cryptocurrency briefly moved above $87,000 before encountering renewed selling pressure. At the time of reporting, Bitcoin traded near $84,000, down nearly 3% over 24 hours but up approximately 10% over the previous week.
Ethereum was trading near $2,700, down close to 3% in one day while gaining 10% over seven days. Other major cryptocurrencies posted steeper declines, with XRP dropping 6.5% in 24 hours, Dogecoin falling nearly 7%, and Zcash losing more than 6%. The broader crypto market capitalization fell to approximately $2.96 trillion, nearly 3% lower than the previous day, with Bitcoin dominance at just over 57%.
Technical Breadth as a Market Indicator
Moving average breadth measures how many assets trade above a long-term average rather than the magnitude of price gains or sustainability of trends. This metric provides only a snapshot of market participation and does not guarantee future price direction.
Santiment data indicates that Bitcoin's correlations with stocks, gold, and the dollar have weakened, a shift that complicates assumptions about crypto simply mirroring equity market movements.