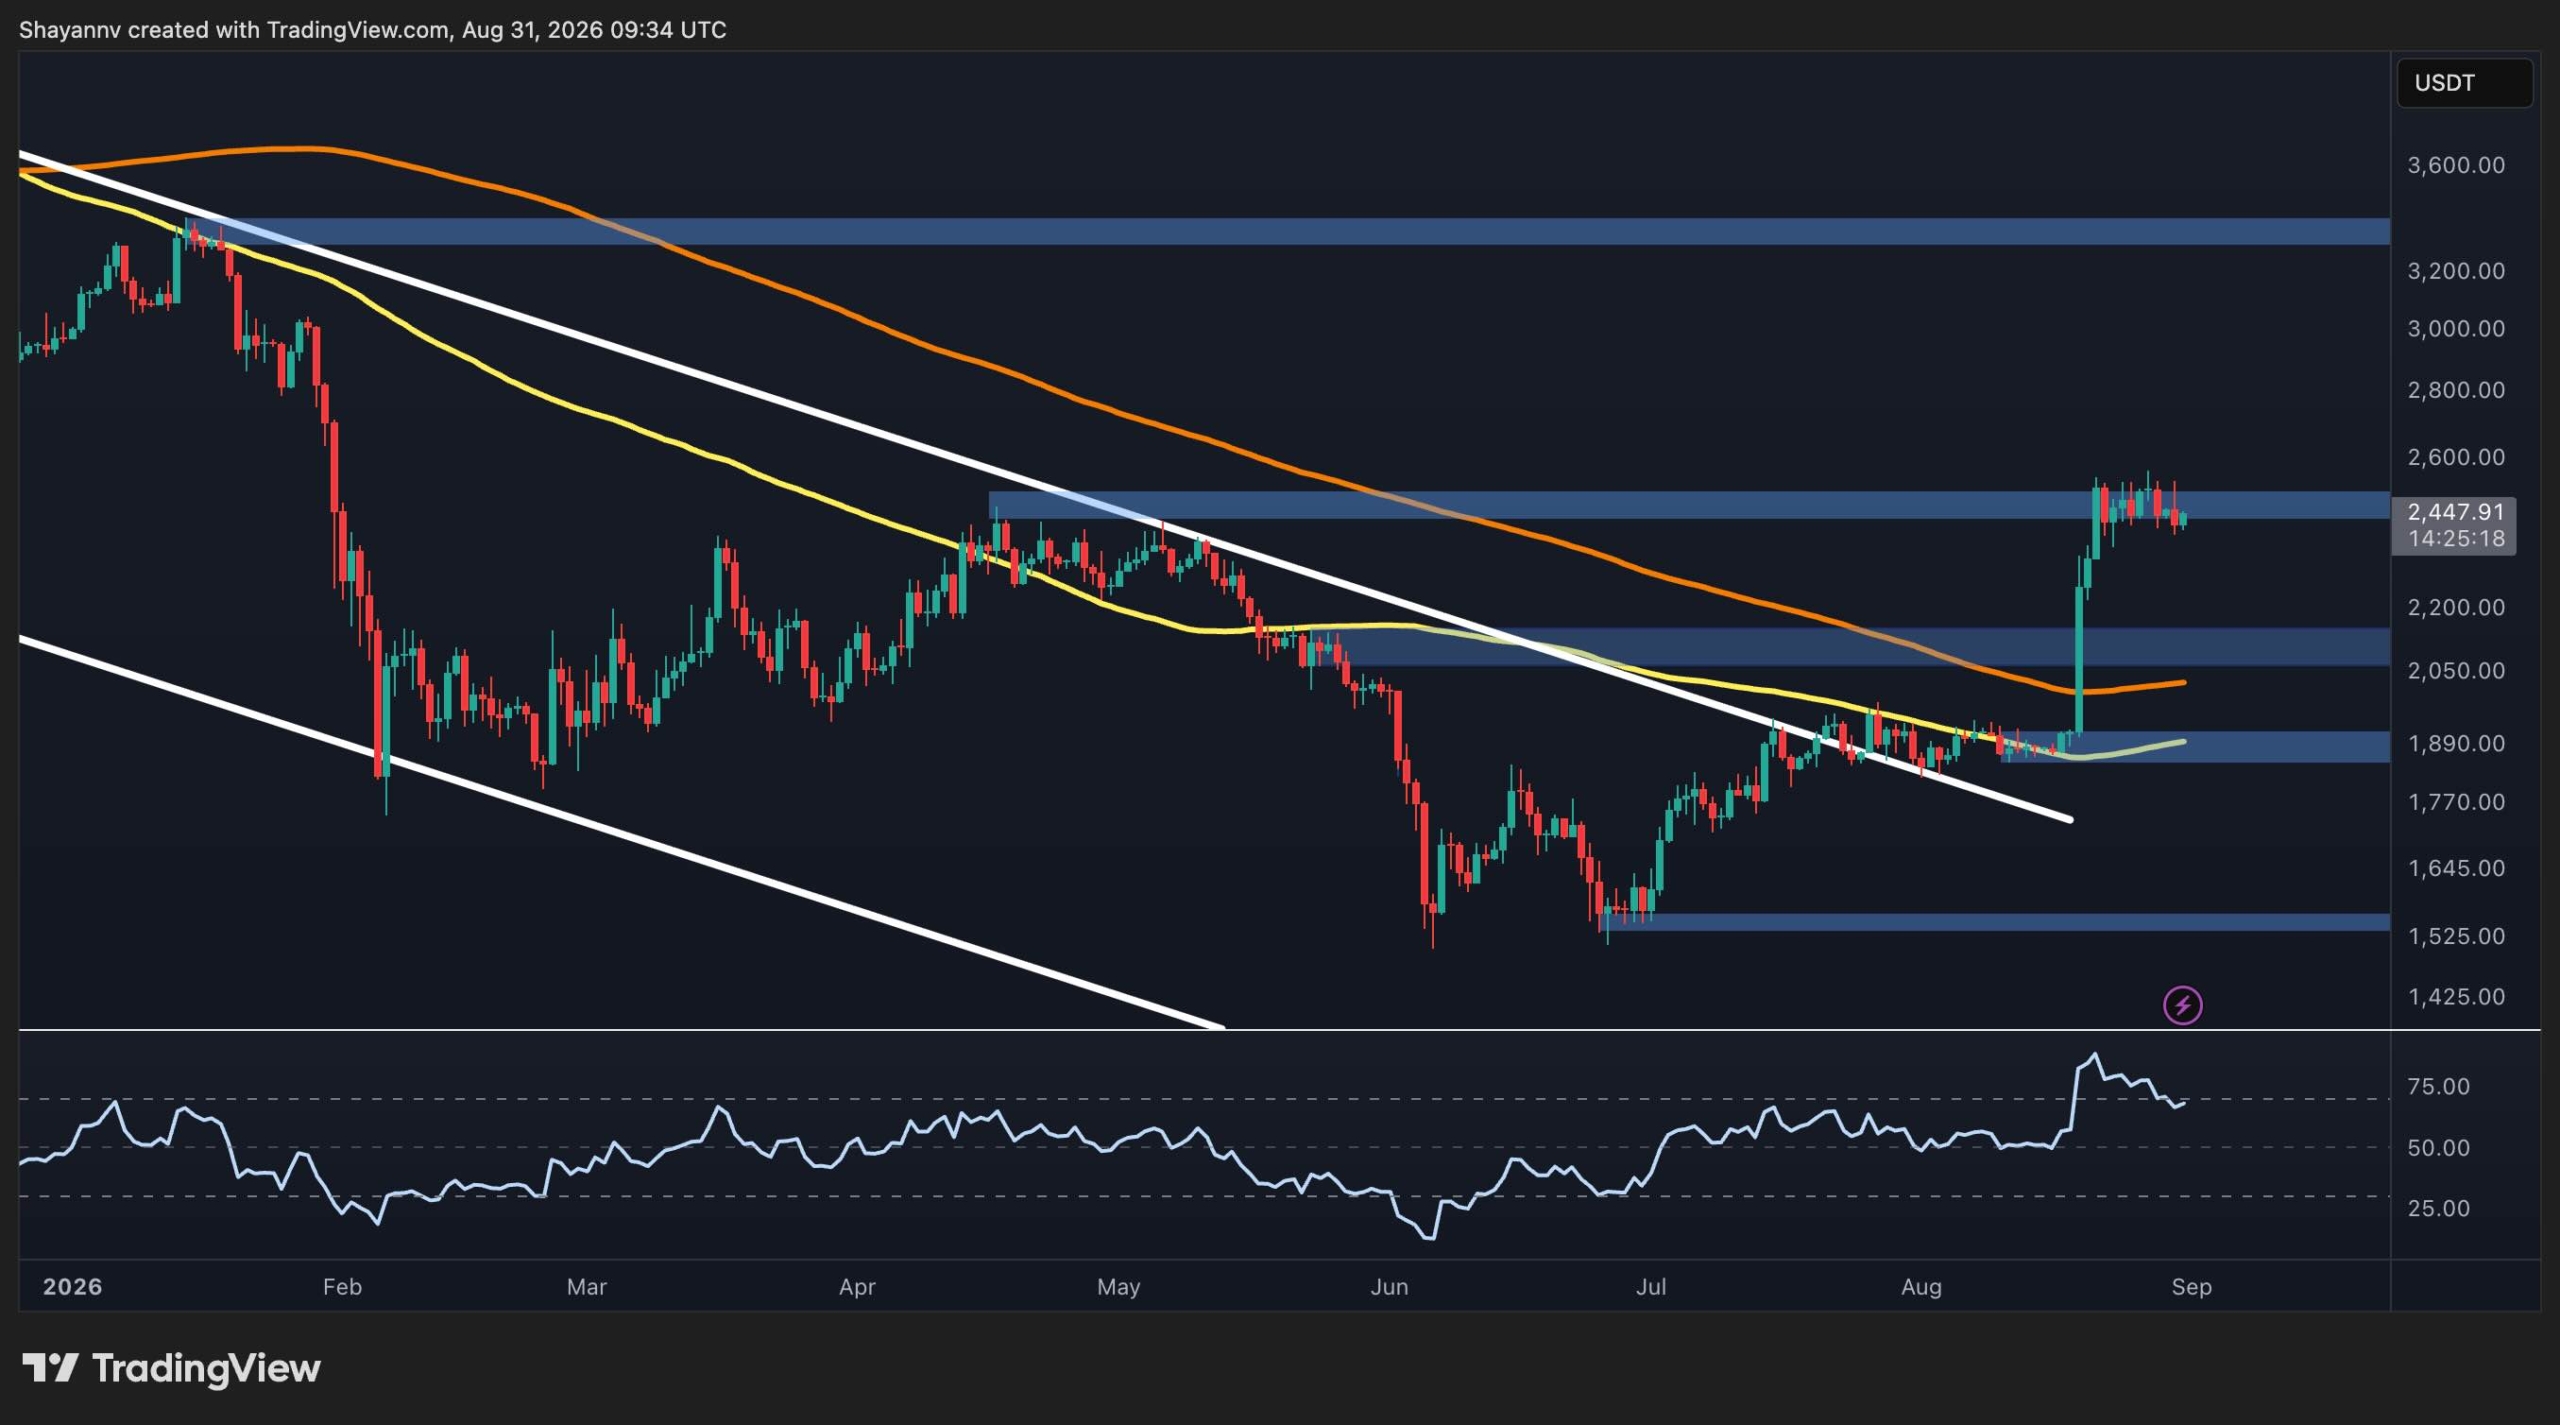
Ethereum is consolidating after a significant price rally, currently trading below the $2.5K level. The move represents a recovery from the $1.9K region, where ETH broke above a descending channel that had contained prices for several months.
Technical Structure Improves
The daily chart shows considerable structural improvement. Ethereum has moved above the 100-day moving average (near $1.9K) and the 200-day moving average (near $2.05K), both of which are now sloping upward. This shift suggests the broader bearish structure is losing momentum.
ETH successfully pushed through $2.1K resistance before accelerating toward the current $2.5K area. However, this zone has repeatedly attracted selling pressure, with several daily candles failing to establish a decisive breakout above $2.5K.
Key Support and Resistance Levels
On the upside, a daily close above $2.5K would strengthen the bullish case and could expose the next major resistance around $3K.
Support levels are defined at $2.1K, which previously acted as resistance and was reclaimed during the latest rally. Holding this zone would keep the bullish breakout structure intact. Below that, the $1.9K region represents another important support level and marks the initial breakout point. A sustained move below $1.9K would weaken the current structure.
Short-Term Consolidation on 4-Hour Charts
The 4-hour chart shows ETH moving sideways within a tight range, with $2.5K acting as the upper boundary. This consolidation can be viewed constructively as long as prices hold the higher levels established during the breakout, rather than immediately reversing the entire move.
The 4-hour RSI has pulled back from overbought territory and is near 50, consistent with a cooling-off phase following the aggressive upward move.
On-Chain Signal: Declining Exchange Reserves
Ethereum held on exchanges has declined from above 21 million ETH in 2025 to approximately 14.9 million ETH at the latest reading. This decline has accelerated in recent months, even during periods of significant price volatility.
The falling exchange reserves suggest that less ETH is immediately available for selling on exchanges. This divergence between declining supply and rising prices is viewed as a constructive signal, potentially indicating longer-term accumulation or movement into self-custody.
Technical and on-chain indicators are currently aligned, with ETH having broken its longer-term descending trend while exchange reserves continue to fall.