Ethereum is consolidating near $2.7K following another rejection from overhead resistance. Buyers have maintained the broader upward structure, but a sustained breakout remains necessary to convert the current consolidation into a fresh advance.
Daily Chart Analysis
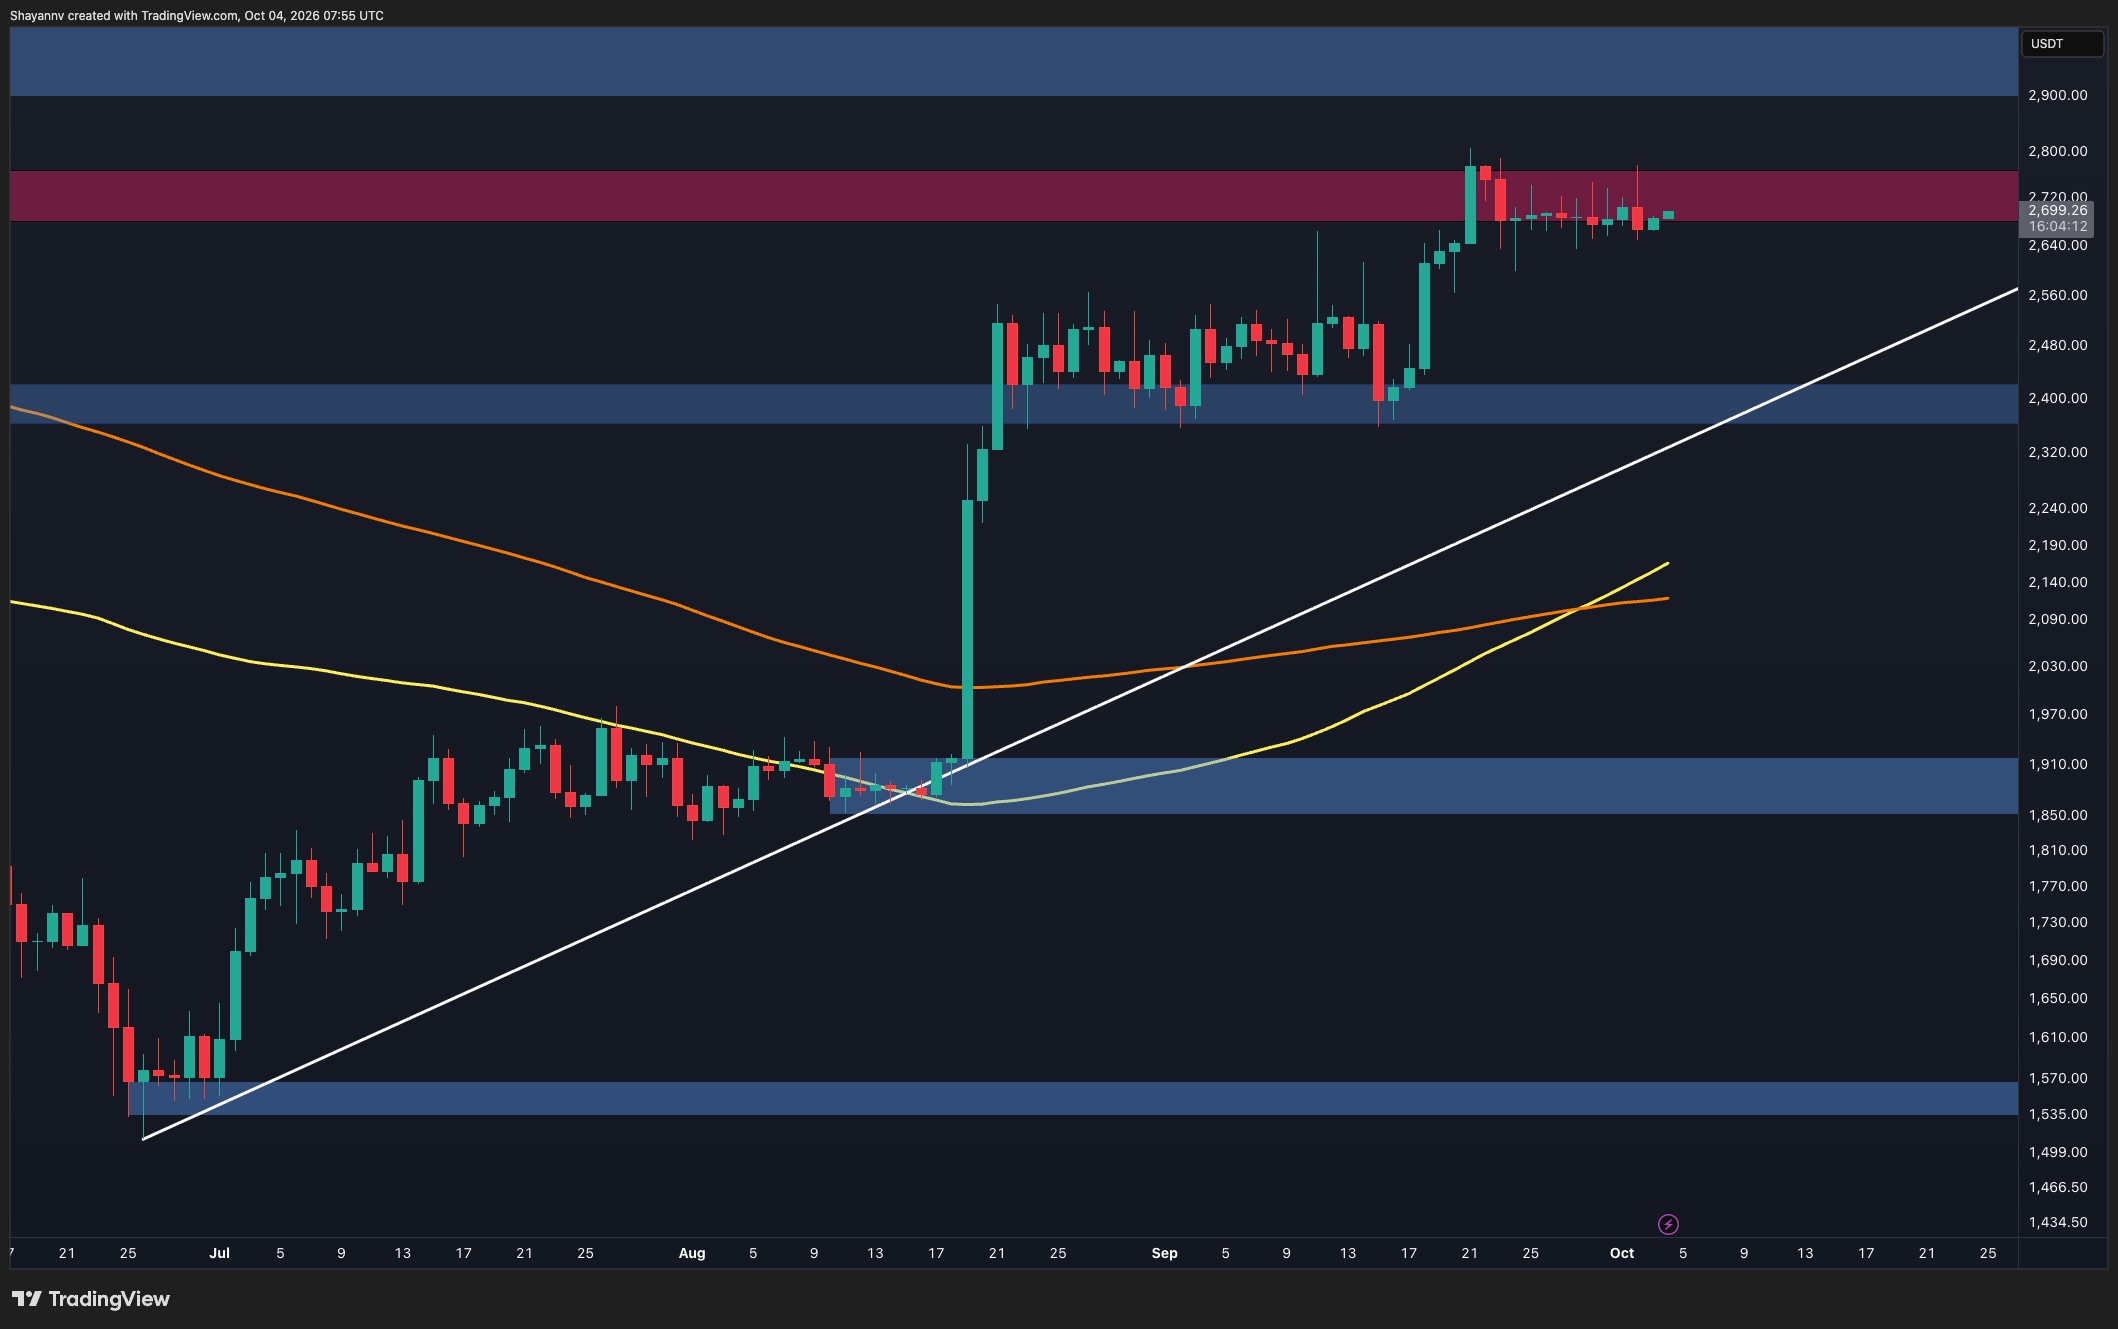
On the daily timeframe, Ethereum is consolidating around the lower boundary of the $2.68K–$2.77K resistance zone. Multiple candles have produced upper wicks in this area, indicating persistent selling pressure. However, the relatively shallow pullback suggests that buyers remain active beneath resistance.
The broader technical outlook remains constructive, with ETH trading above the ascending trendline and both displayed moving averages. The yellow moving average has crossed above the orange average and continues to rise, reinforcing the recovery structure. A decisive daily close above $2.77K, followed by a break of the recent high around $2.8K, could open the path toward the $2.9K–$3K resistance zone.
On the downside, a loss of the consolidation lows around $2.64K would increase the likelihood of a deeper correction toward the rising trendline and the $2.36K–$2.42K support zone.
Four-Hour Chart Technical Setup
The 4-hour chart shows Ethereum trading within an ascending channel. Following rejection near the upper boundary around $2.78K, the price pulled back toward the channel's midpoint and has since recovered to approximately $2.7K, suggesting the latest decline remains a correction within the broader upward structure.
The immediate obstacle is the $2.68K–$2.77K supply zone. Holding above the channel midpoint around $2.67K could support another attempt to clear this barrier. A successful breakout would bring the upper channel boundary, currently around $2.8K–$2.82K, into focus.
A sustained move below the midpoint and recent $2.65K lows would weaken the near-term outlook and could expose the $2.63K and $2.58K support areas, followed by the $2.44K–$2.48K demand zone.
Liquidation Levels
The two-week Binance ETH/USDT liquidation heatmap shows substantial liquidation clusters above and below the current price. A notable overhead band sits around $2.78K–$2.8K, with additional concentrations extending toward $2.85K. Below price, a prominent cluster appears around $2.61K–$2.63K, alongside a broader concentration across the $2.55K–$2.6K region.
The overhead cluster aligns closely with recent price highs and the upper portion of the technical resistance area. If buyers establish a sustained breakout above $2.77K, short liquidations around $2.78K–$2.8K could amplify the advance. Conversely, losing nearby channel support could bring the $2.61K–$2.63K liquidation pool into play, potentially accelerating a decline as leveraged longs unwind.