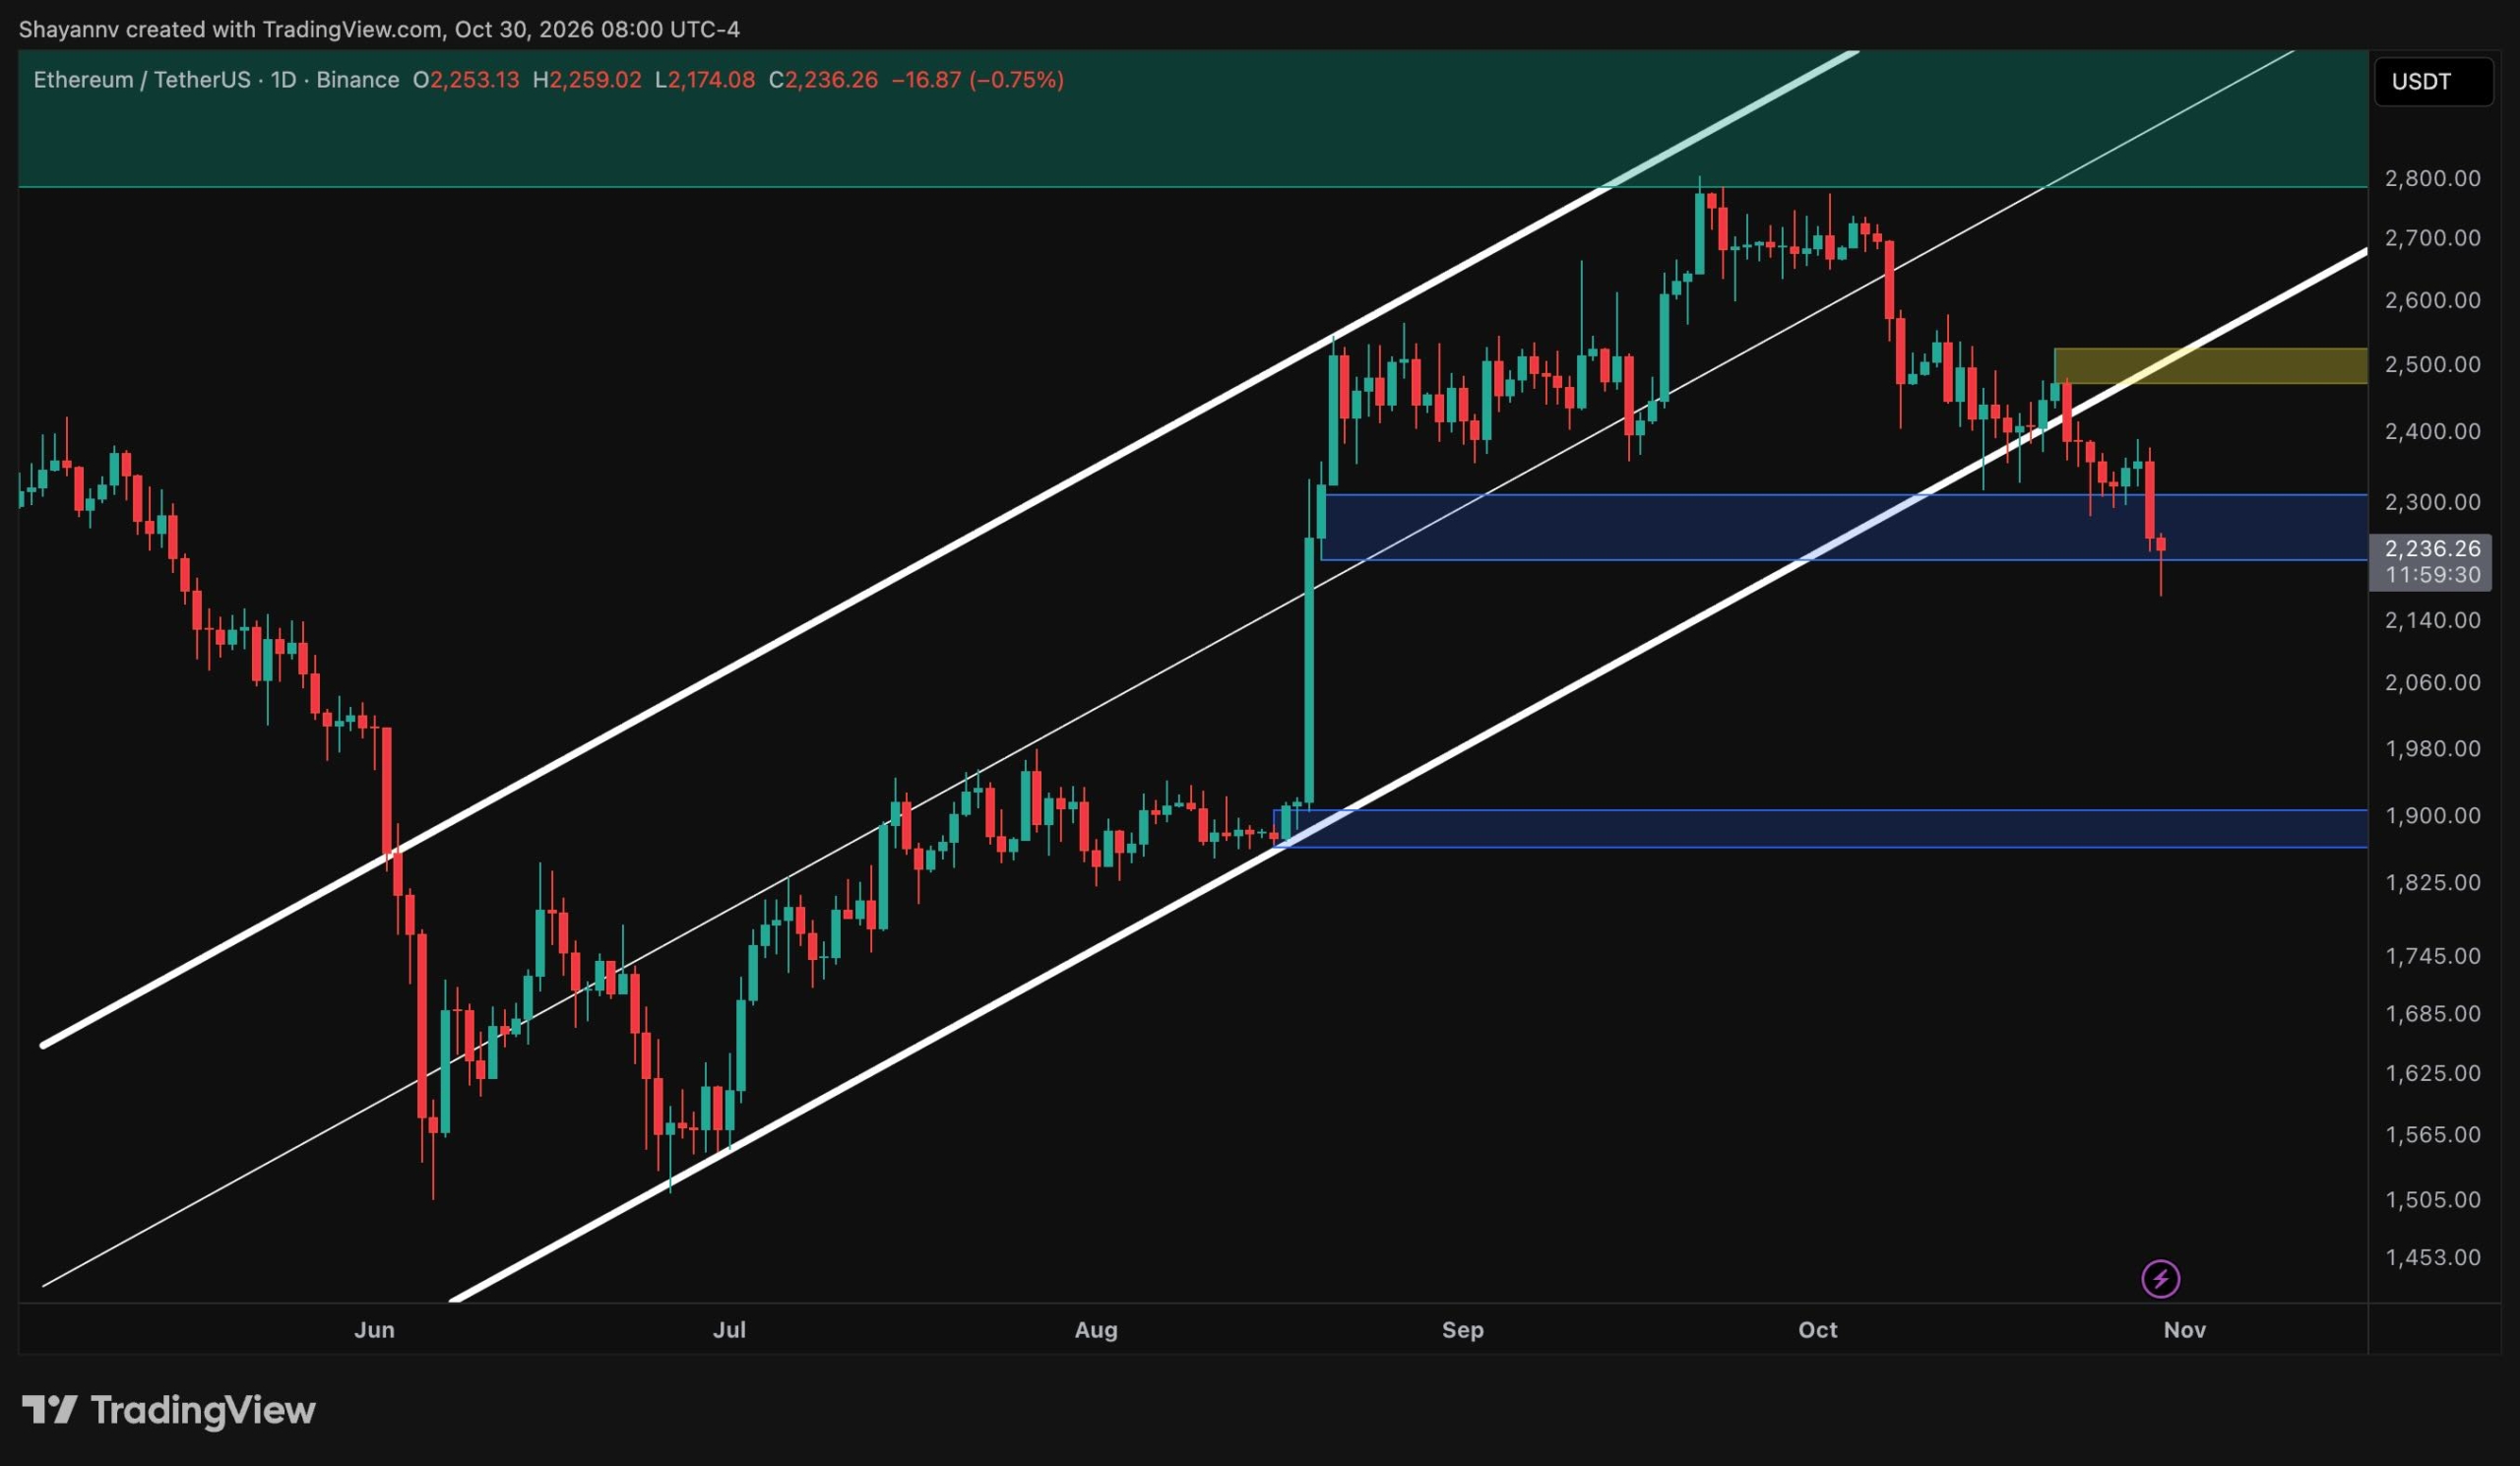
Ethereum has slipped toward $2.2K following a wave of selling that extended losses from the $2.8K highs reached in September. The asset is now trading within a critical demand zone that coincides with the lower boundary of its short-term descending channel, a technical level that could prove decisive for the near-term direction.
Daily Chart Analysis
On the daily timeframe, Ethereum has broken below the ascending channel that carried the price higher from June lows near $1.5K. After rejection from the $2.8K supply zone in September, ETH fell below the channel's lower boundary and retested it around $2.5K, where sellers rejected the price again. The failed retest suggests this level has transitioned from support to resistance.
The current decline has brought the asset into the $2.2K–$2.3K demand zone, located below the consolidation that followed August's sharp rally. The price briefly wicked toward $2.15K before recovering, indicating buyer interest at this level. However, the rebound remains modest, and the zone has not yet produced a convincing reaction.
If support holds at $2.2K, Ethereum could attempt a recovery toward $2.5K. A daily close below $2.2K would expose the $1.9K order block, which represents the base of the August rally and the next major demand area.
Four-Hour Technical Setup
On the 4-hour chart, Ethereum has traded within a descending channel since early October, marked by consistent lower highs and lower lows. The upper boundary has functioned as dynamic resistance, notably on October 21 when the price was rejected from the $2.5K zone. After ranging between approximately $2.3K and $2.4K for several days, ETH broke lower aggressively, briefly reaching the channel's lower boundary near $2.15K before buyers stepped in.
Ethereum is consolidating around $2.24K within the horizontal demand zone. This confluence of channel support and horizontal demand creates a technically significant area in the short term. A successful defense could produce a relief bounce toward the $2.4K range and the channel's upper boundary near $2.42K. Conversely, a confirmed move beneath the lower trendline would indicate sellers have regained control, with the $1.9K region as the next likely target.
Sentiment Indicator
The Coinbase Premium Index, which measures the price difference between ETH on Coinbase and Binance, has fallen to approximately -0.21. This represents the lowest reading visible in the available period and reflects notably weak demand from US investors. Throughout mid-2025, the index remained largely positive as ETH rallied. Since November 2025, readings have been predominantly negative, coinciding with the asset's extended downtrend.
A similar extreme reading occurred in February 2026 close to a local low, suggesting the current metric could reflect capitulation rather than sustained selling. For Ethereum to defend the $2.2K support and challenge the $2.5K resistance, the Coinbase Premium Index would need to recover alongside price recovery.