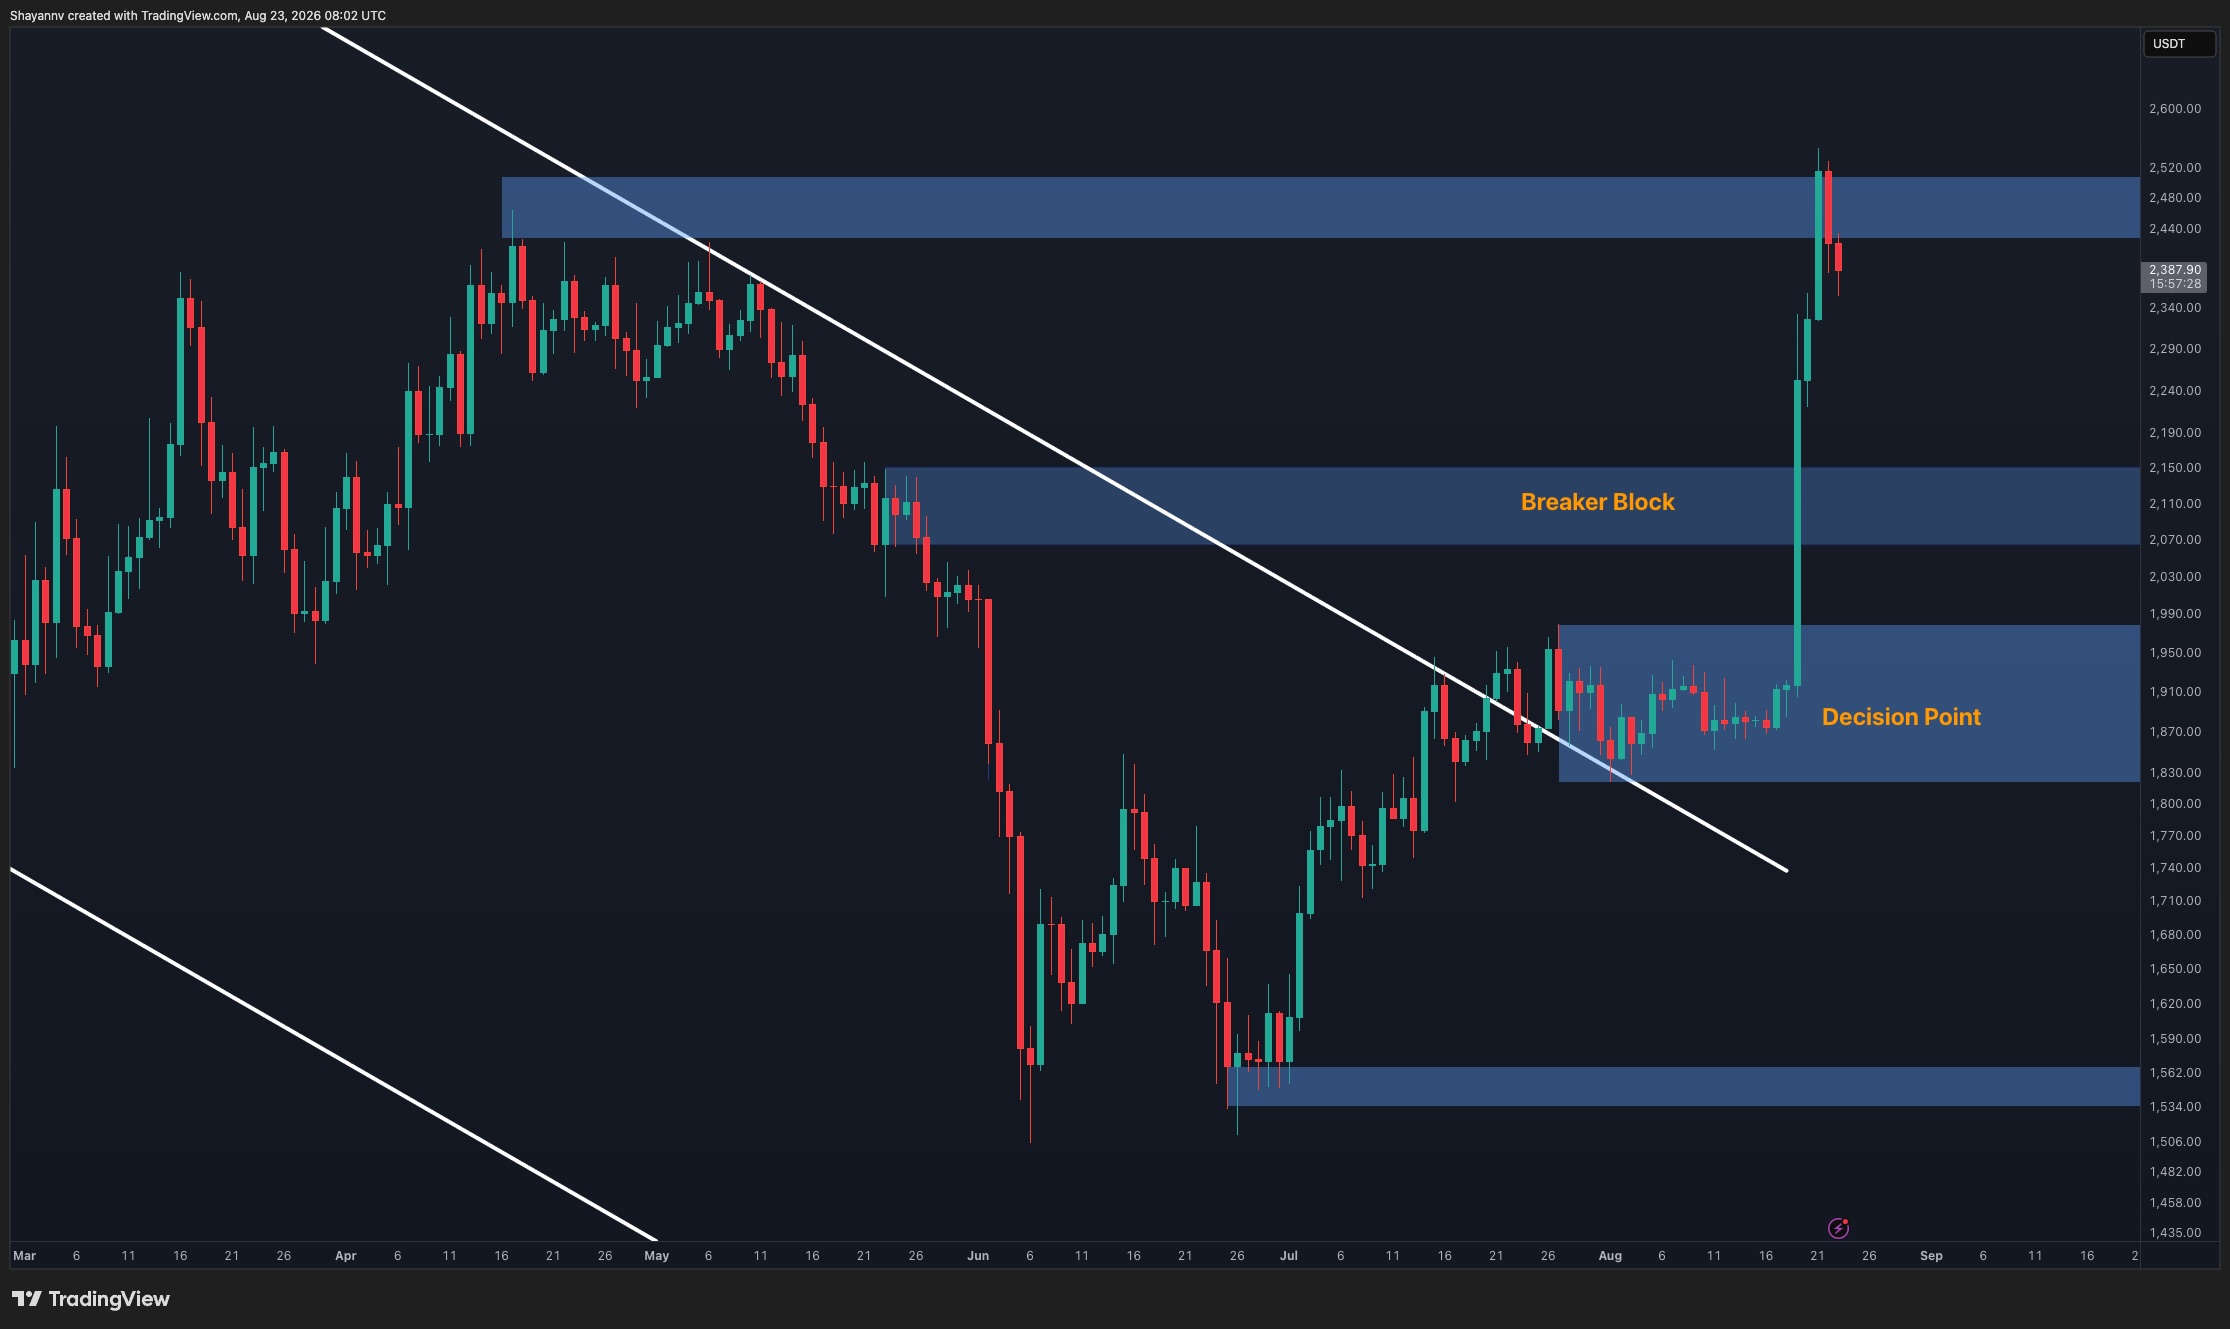
Ethereum has experienced a significant structural breakout, shifting market momentum in favor of buyers after a period of consolidation between $1.83K and $1.97K. The asset successfully broke a long-standing descending trendline and cleared a breaker-block zone between $2.07K and $2.15K before surging toward a resistance area between $2.44K and $2.51K.
After briefly pushing toward $2.55K, sellers stepped in and the price retreated to approximately $2.39K. Given the speed of the preceding advance, technical indicators suggest a period of consolidation or a deeper correction may occur before the market attempts to reclaim the $2.44K–$2.51K resistance zone.
On the 4-hour chart, Fibonacci retracement levels outline potential correction targets if the pullback extends. The 0.5 retracement sits near $2.21K, while the 0.618 level at $2.13K aligns with the $2.07K–$2.15K support zone. This $2.07K–$2.21K region serves as the primary pullback zone if short-term downward pressure continues, with a decisive loss of the $2.07K area exposing the 0.786 retracement near $2.01K.
Additionally, the one-week Ethereum liquidation heatmap indicates a concentration of liquidity below the current market, specifically above the $2.2K level. This cluster overlaps with the 4-hour 0.5 Fibonacci retracement, suggesting that a liquidity sweep toward the $2.2K region could occur as part of a post-breakout correction without altering the broader structure.