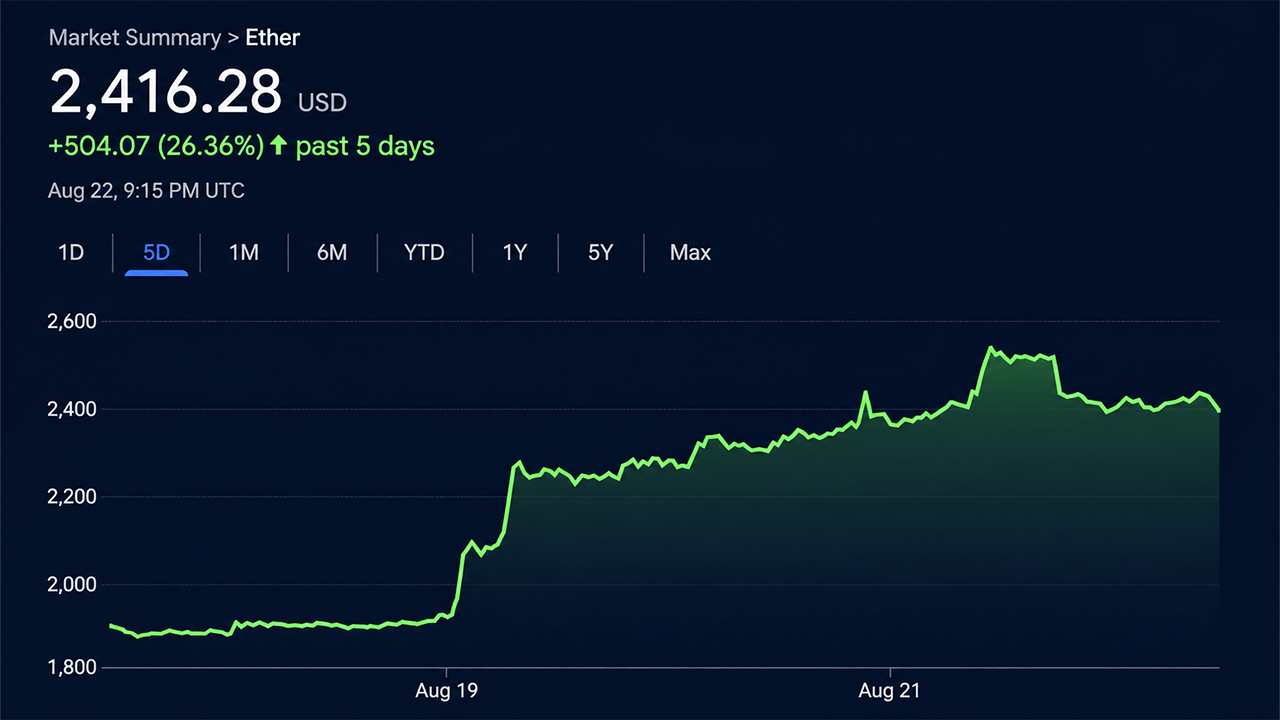
Ethereum (ETH) surged 29.8% over a seven-day period, outpacing bitcoin's 22.9% gain and climbing to a weekly high of $2,546 on Saturday afternoon. After cooling slightly, ETH traded around $2,435 late Saturday as its share of the broader crypto market moved closer to 11%.
The breakout gained momentum on August 19 when ETH rose approximately 17.5%, moving from near $1,917 to close above $2,250. Buyers maintained pressure over subsequent sessions, pushing the price to a peak of $2,546.78 on Binance, accompanied by daily trading volumes repeatedly hitting between $25 billion and $33 billion. Meanwhile, bitcoin traded around $77,300 at the same time on Saturday.
Spot ethereum exchange-traded funds (ETFs) recorded approximately $697 million in net inflows for the week, marking their strongest stretch since October 2025. Products such as Blackrock’s ETHA, Grayscale Mini ETH, and Fidelity’s FETH contributed to the demand, bringing total assets under management in spot Ethereum ETFs toward $14.3 billion, or about 4.85% of Ethereum’s market capitalization.
Supply dynamics also shifted as exchange-held ethereum fell about 15% between early June and mid-August, dropping from roughly 7.7 million ETH to 6.54 million ETH. Additionally, more than 42 million ETH—representing about 33.7% of the total supply—remained locked in staking.
Derivatives markets experienced heavy turbulence during the rally. Coinglass data showed that ETH accounted for $264.92 million of a broader $1.21 billion crypto liquidation wipeout over a 24-hour window. Ethereum futures open interest stood at $31.81 billion, equivalent to 13.06 million ETH, with Binance leading exchanges at $8.77 billion.
Options data revealed a bullish tilt in open interest, with calls representing 58.41% (1.60 million ETH) and puts accounting for 41.59% (1.14 million ETH) on Saturday afternoon. However, fresh 24-hour trading volume favored puts at 56.09% over calls at 43.91%, reflecting hedging activity after the sharp price increase.
Daily relative strength index (RSI) readings between 78 and 88 indicated overbought conditions. Traders are currently monitoring support zones around $2,400 to $2,450, followed by $2,300, while watching upcoming ETF flows and broader market conditions.