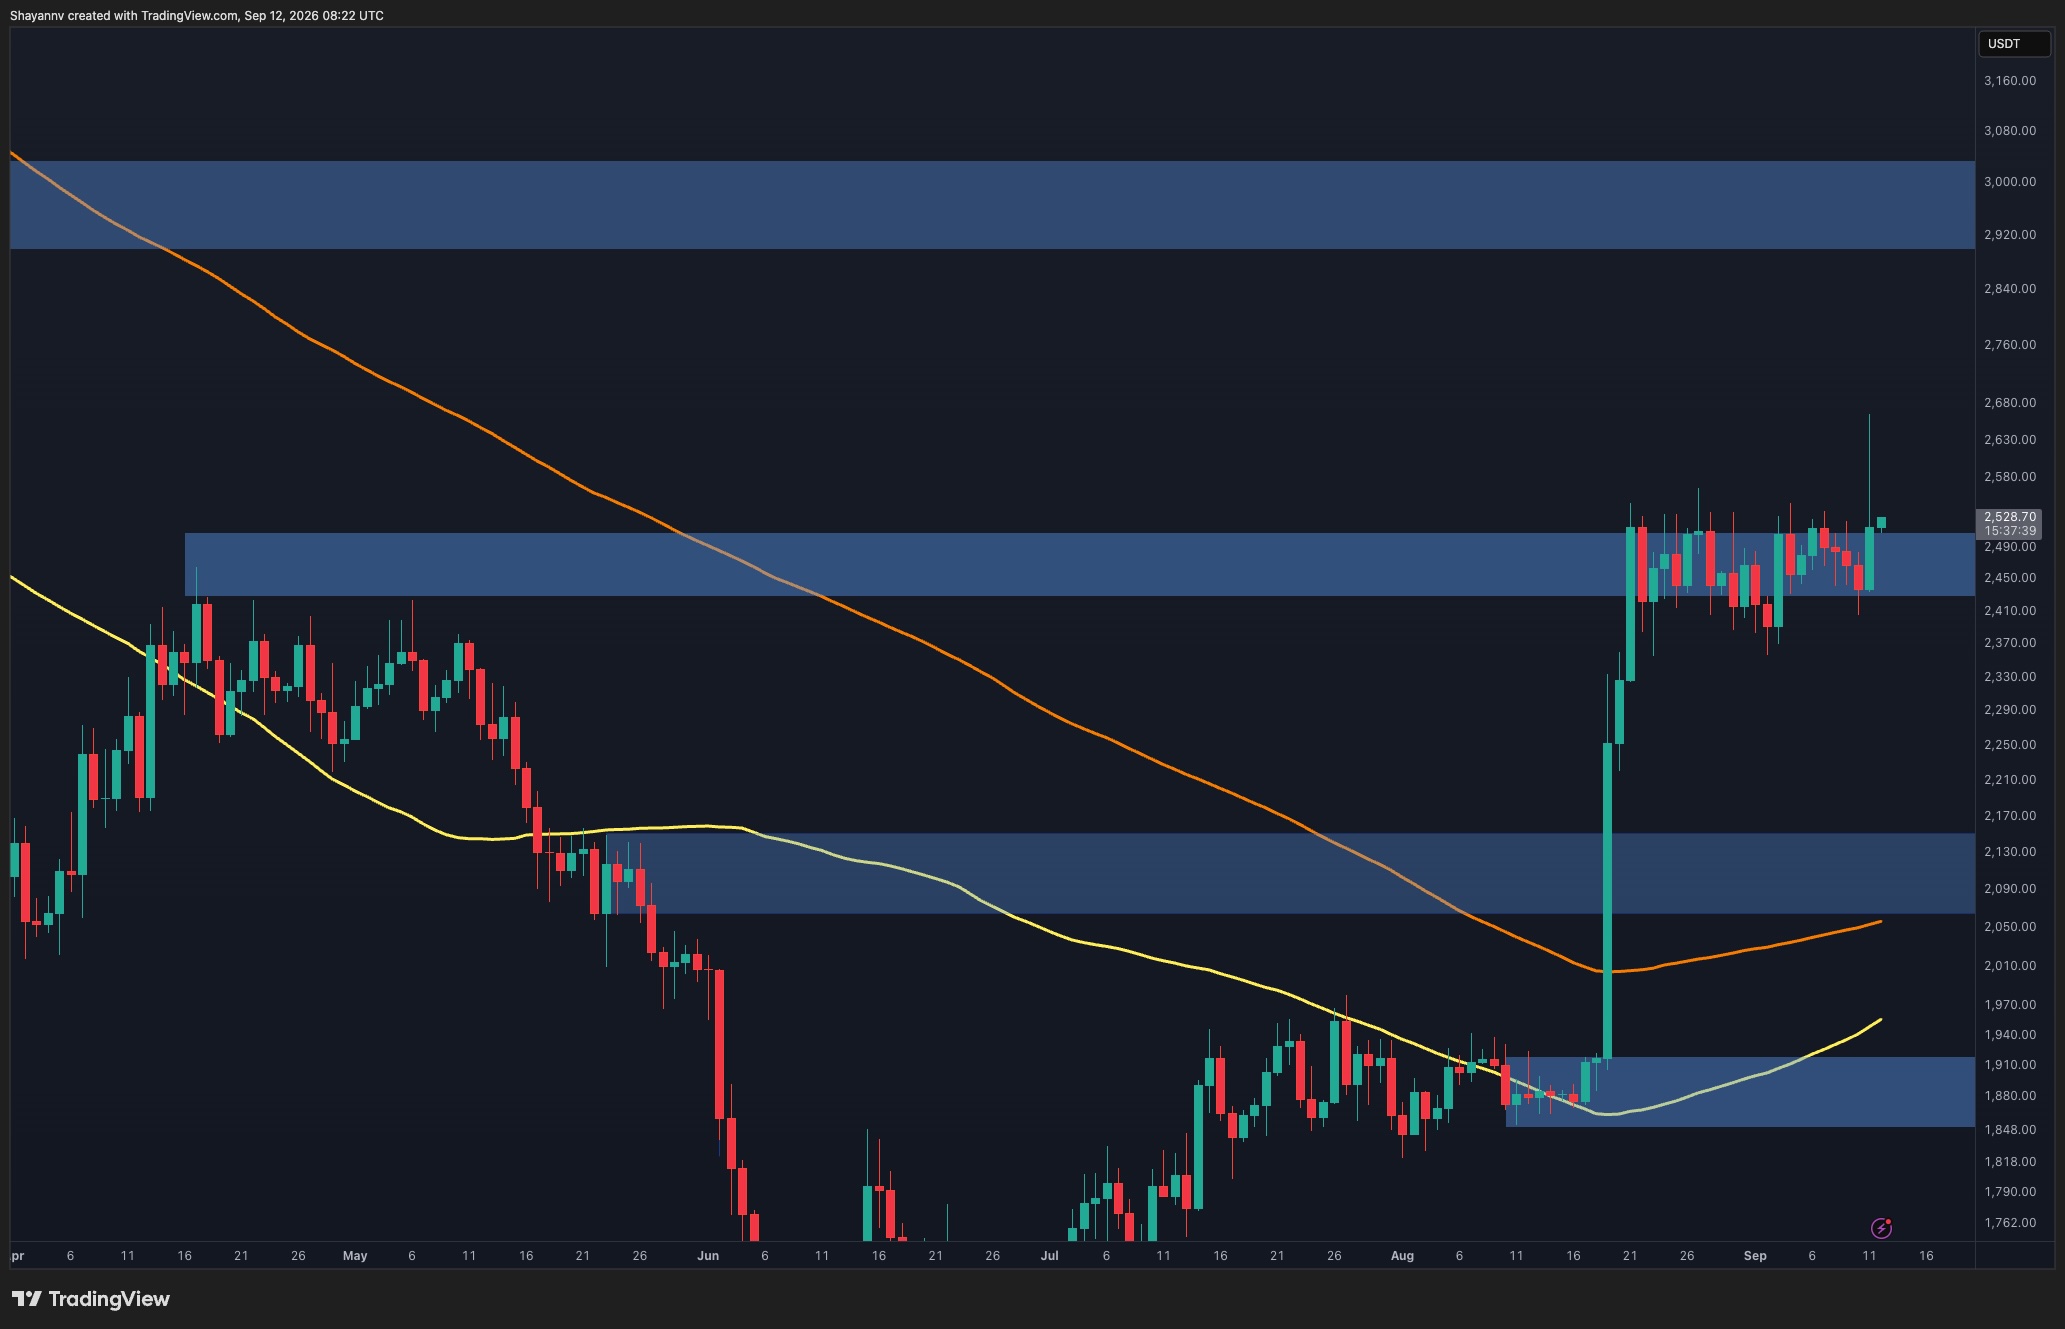
Ethereum traded near $2,507 on September 13, with analysts monitoring technical formations for potential breakout signals. Bitcoin held near $77,329, while XRP traded around $1.36 and Solana near $101.19.
Technical Analysis Points to Triangle Formation
Analyst Ali Charts identified a triangle pattern forming on the 12-hour timeframe. According to the analysis, a previous similar triangle breakout preceded a 31% gain over three days. The analyst suggested that if Ethereum breaks above current resistance levels, a comparable rally could push the price toward $3,000. A sustained move above $2,550 is cited as a potential catalyst for this scenario.
Technical indicators showed mixed signals. The MACD line measured 6.47, below its signal line of 9.24, with a histogram of -2.76 indicating weakening upward momentum. The RSI stood at 51.77, just above the neutral 50 level. Support levels are identified at $2,490 and $2,400, while resistance points include $2,550 and the recent high of $2,600.
Ethereum ETFs See Significant Inflows
On September 11, Ethereum exchange-traded funds received net inflows of $216.41 million. BlackRock's ETHA led with $148.82 million, followed by Bitwise's ETFW with $29.09 million. BlackRock ETHB recorded $18.32 million, Fidelity FETH $11.40 million, VanEck's ETHV $3.71 million, and Grayscale's ETH fund $5.09 million.
Historical inflows totaled $13.39 billion with total net assets at $16.31 billion, representing 5.28% of Ethereum's market capitalization. ETF trading volume reached $2.56 billion on September 11.
Market Events Could Influence Direction
Investors are monitoring the Federal Reserve meeting scheduled for September 15-16, which could reshape interest rate expectations and risk-asset sentiment. Additionally, a procedural vote on the CLARITY Act is scheduled for September 15, representing another potential market catalyst.