The CNN Fear & Greed Index dropped to 14 on November 20, 2026, placing US stock sentiment firmly in "Extreme Fear" territory. The reading represents the lowest level since March 30 and reflects a sharp eight-day decline of 26 points from a reading of 40 one week prior.
The deterioration was steep. One week earlier, the index sat at 37, already in fear territory, before accelerating downward. Over a 30-day window, the gauge has oscillated between 14 and 40, with the current reading at the bottom of that range.
Key Components Driving the Decline
Several market indicators contributed to the extreme fear reading:
- S&P 500 momentum: Scored at 1, indicating the index has fallen below its recent trend
- Stock price breadth: Measured at 22.8, showing weakness is broad rather than concentrated in specific stocks
- Volatility: The VIX registered at 13.82, signaling extreme fear
- Asset demand: Investors have retreated from riskier corporate debt in favor of safe-haven holdings
Crypto Markets Mirror Equity Sentiment
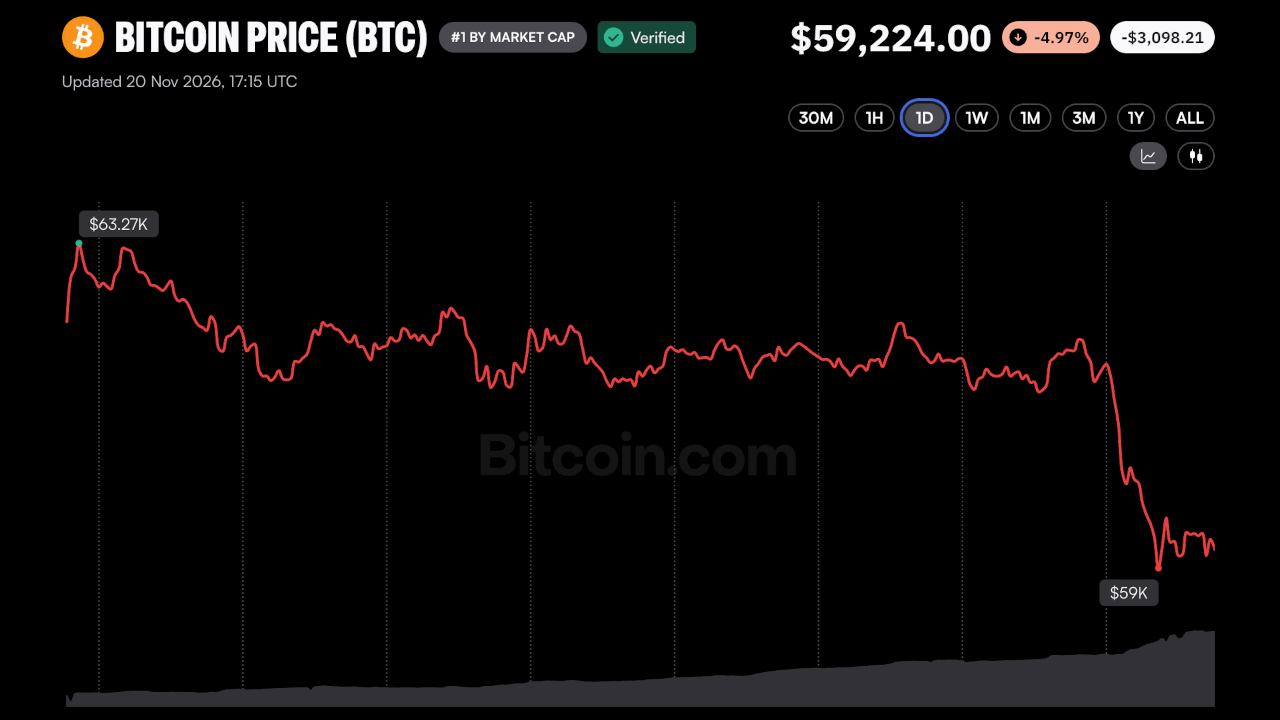
Bitcoin's sentiment index stood at 12 on November 20, also in extreme fear territory and slightly below the equity reading of 14. The Nasdaq sat near 13, placing Bitcoin, tech stocks, and the broader S&P 500 within a couple of points of each other near the bottom of the fear scale.
Historical Context
The March 30 reading of approximately 10.2 remains the year's benchmark for pessimism. The current reading of 14 has not matched that low but represents the closest approach since then. The gap between the two readings suggests the market is a few points away from revisiting spring panic levels.
Implications for Investors
Extreme fear readings typically alter investor behavior. Research suggests the current environment may result in pulled-back investment activity and subdued trading volumes as investors await clearer signals. Investors may favor value stocks and safe-haven assets while stepping away from speculative positions. For cryptocurrency, the outlook points toward a risk-off attitude paired with heightened volatility.
A critical question for investors is whether Bitcoin continues tracking equities or begins to decouple. Monitoring the March 30 low of approximately 10.2 provides a key threshold—a break below would mark a new yearly low, while a move back toward the 30-day high of 40 would suggest the panic was temporary.