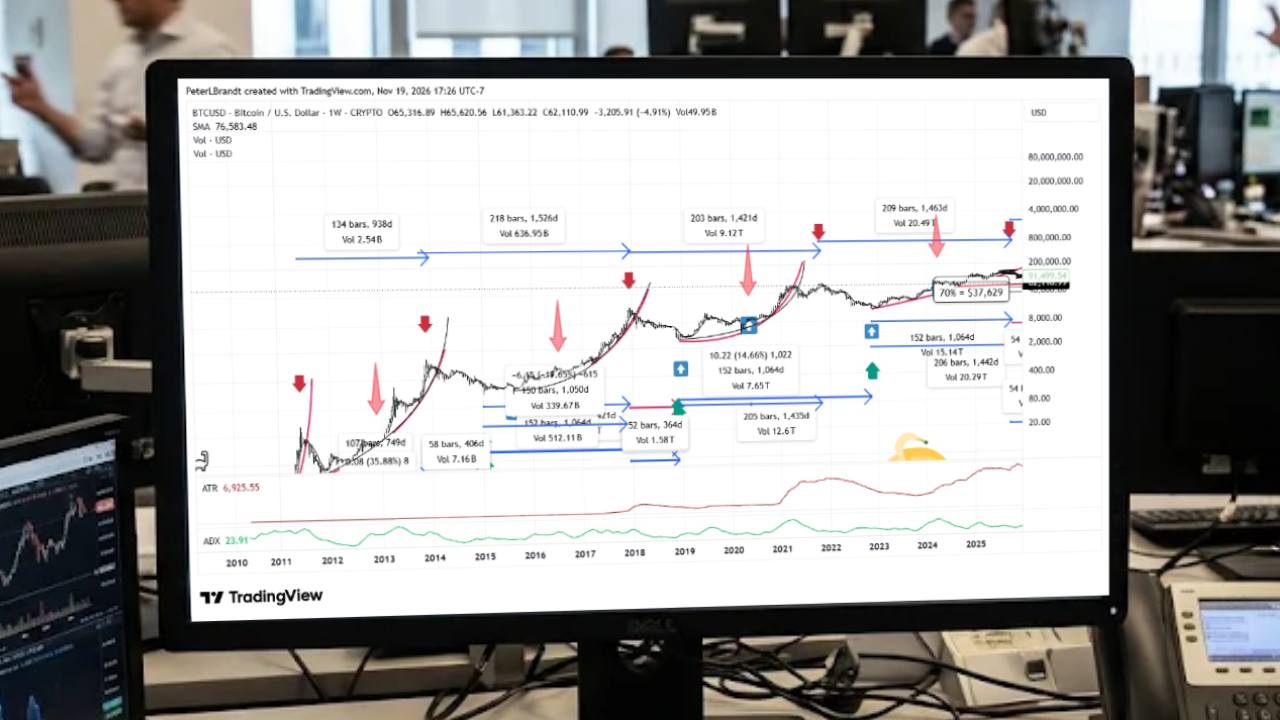
Stocks and cryptocurrencies enter a holiday-shortened week following one of their worst stretches in recent years. The Nasdaq 100 lost more than 10% last week, marking its steepest weekly decline since the 2020 Covid crash, while Bitcoin dropped to its lowest level in over two years before bouncing back toward $61,000.
Fresh inflation and growth data, combined with billions of dollars in potential forced selling, pose further downside risks for markets.
Tech Sector Under Pressure
Nvidia experienced its sharpest weekly drop in 18 years, falling 23% and extending a seven-week losing streak—the chipmaker's longest since the 2008 financial crisis.
Anthropic, the artificial intelligence company behind Claude, raised a record $93.5 billion in its IPO, plus an additional $26 billion from tech companies that purchased shares at the offer price. Shares jumped 17% on Thursday, lifting the company's market value to $1.8 trillion, but the rally faded quickly. The stock fell 8.5% on Friday to close at $88.91 and declined another 1.25% in after-hours trading. Its fully diluted market value of $1.6 trillion ranks among the largest in the United States.
Key Economic Data This Week
Several economic indicators scheduled for release could move markets during the shortened week:
- Monday, November 23: S&P Global services and manufacturing PMI data for November
- Tuesday, November 24: November consumer confidence
- Wednesday, November 25: October PCE inflation, the second reading of Q3 GDP, and October new home sales
- Thursday, November 26: US markets closed for Thanksgiving
- Friday, November 27: Early close for US stock markets
Wednesday represents the most significant data release. Headline PCE inflation is expected to rise to 3.8% from 3.6%, close to double the Federal Reserve's 2% target. Markets currently price in a 90% chance of a 25 basis point rate hike in December. A higher-than-expected inflation reading could increase concerns about tighter monetary policy.
The first estimate put Q3 GDP growth at 3.4%. A downward revision combined with persistent inflation would add to worries that economic growth is slowing while prices remain elevated.
Cryptocurrency Price Action
Bitcoin fell to nearly $55,000, its lowest level since September 2024, before rebounding from support levels that held between July and September 2024. The 3-day relative strength index has entered oversold territory, historically followed by relief rallies of varying duration. The weekly Supertrend remains bearish, suggesting a short-term recovery is more likely than a full trend reversal. Bitcoin is currently struggling at $61,000.
Ethereum is bouncing from its $1,510 to $1,570 support zone, with potential near-term resistance at $1,730 to $1,820. Choppy sideways trading is likely in the near term.
XRP is showing an early bullish divergence on the daily chart. A close at or above $0.93 would preserve XRP's last major weekly support level.
Levels to Monitor
Bitcoin: Resistance at $61,000 to $62,000, then $65,000 to $67,000. Support at $53,000 to $56,000, with heavy liquidity near $52,000.
Ethereum: Resistance at $1,730 to $1,820. Support at $1,510 to $1,570.
XRP: Resistance at $0.99 to $1.02. Weekly support near $0.93.