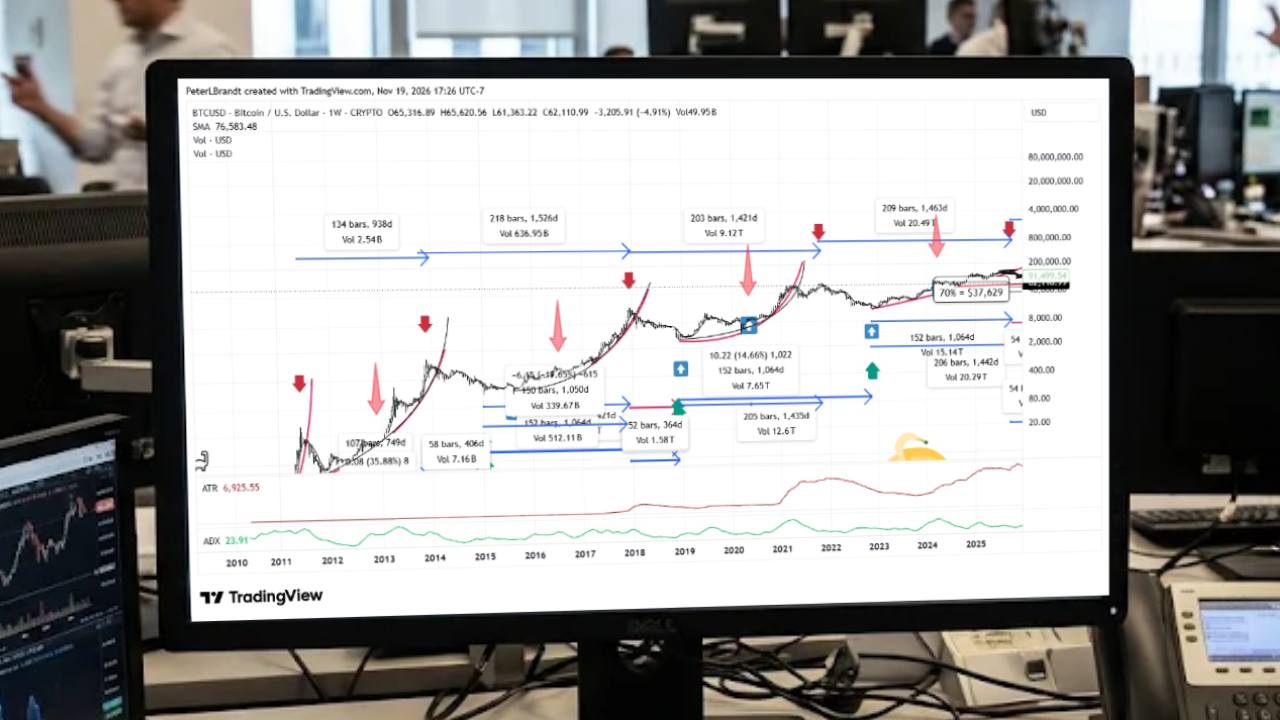
Veteran futures trader Peter Brandt has compared bitcoin's recent decline to past market corrections, suggesting the current sell-off may follow a historical pattern. On November 19, Brandt noted that every major bull market phase in bitcoin's history has ended with corrections of at least 75% from the previous peak.
Brandt's analysis examined multiple cycles of rapid gains followed by sharp reversals. In his assessment, he wrote: "Every bull market phase in BTC's history has ended with at least a 75% correction of the previous parabolic bull trend. Could this be what's happening in bitcoin?"
Historical Decline Patterns
Bitcoin's peak-to-trough decline in 2022 reached approximately 77%, with the price falling from $68,789 in November 2021 to $15,479 a year later. Research firm Glassnode measured historical bear-market losses across completed cycles at roughly 75% to 93%, though the firm cautioned that the sample size is small and the selection of peaks affects the comparison.
Brandt's June 2024 analysis examined the timing between halvings and market peaks, measuring the start of new cycles from lows that followed 75% declines. He found that the time from those lows to the next halving was nearly equivalent to the time from the halving to the subsequent peak.
Current Price Movements and Key Levels
Bitcoin recently fell to approximately $55,300, representing a decline of roughly 56% from its October 2025 record of $126,080. The cryptocurrency rebounded above $60,000 by midmorning Eastern time on November 21.
Brandt identified $57,803 as a significant technical level, marking it on a weekly chart on November 20. He indicated that territory below this level could prove particularly volatile, stating: "The territory below this level gets very dicey $BTC."
Earlier in the year, Brandt had projected a potential bitcoin bottom range of $40,000 to $50,000, with declines expected in early October. At that time, he suggested bitcoin had matured enough to potentially avoid the 80% or greater declines associated with its earlier major bear markets.