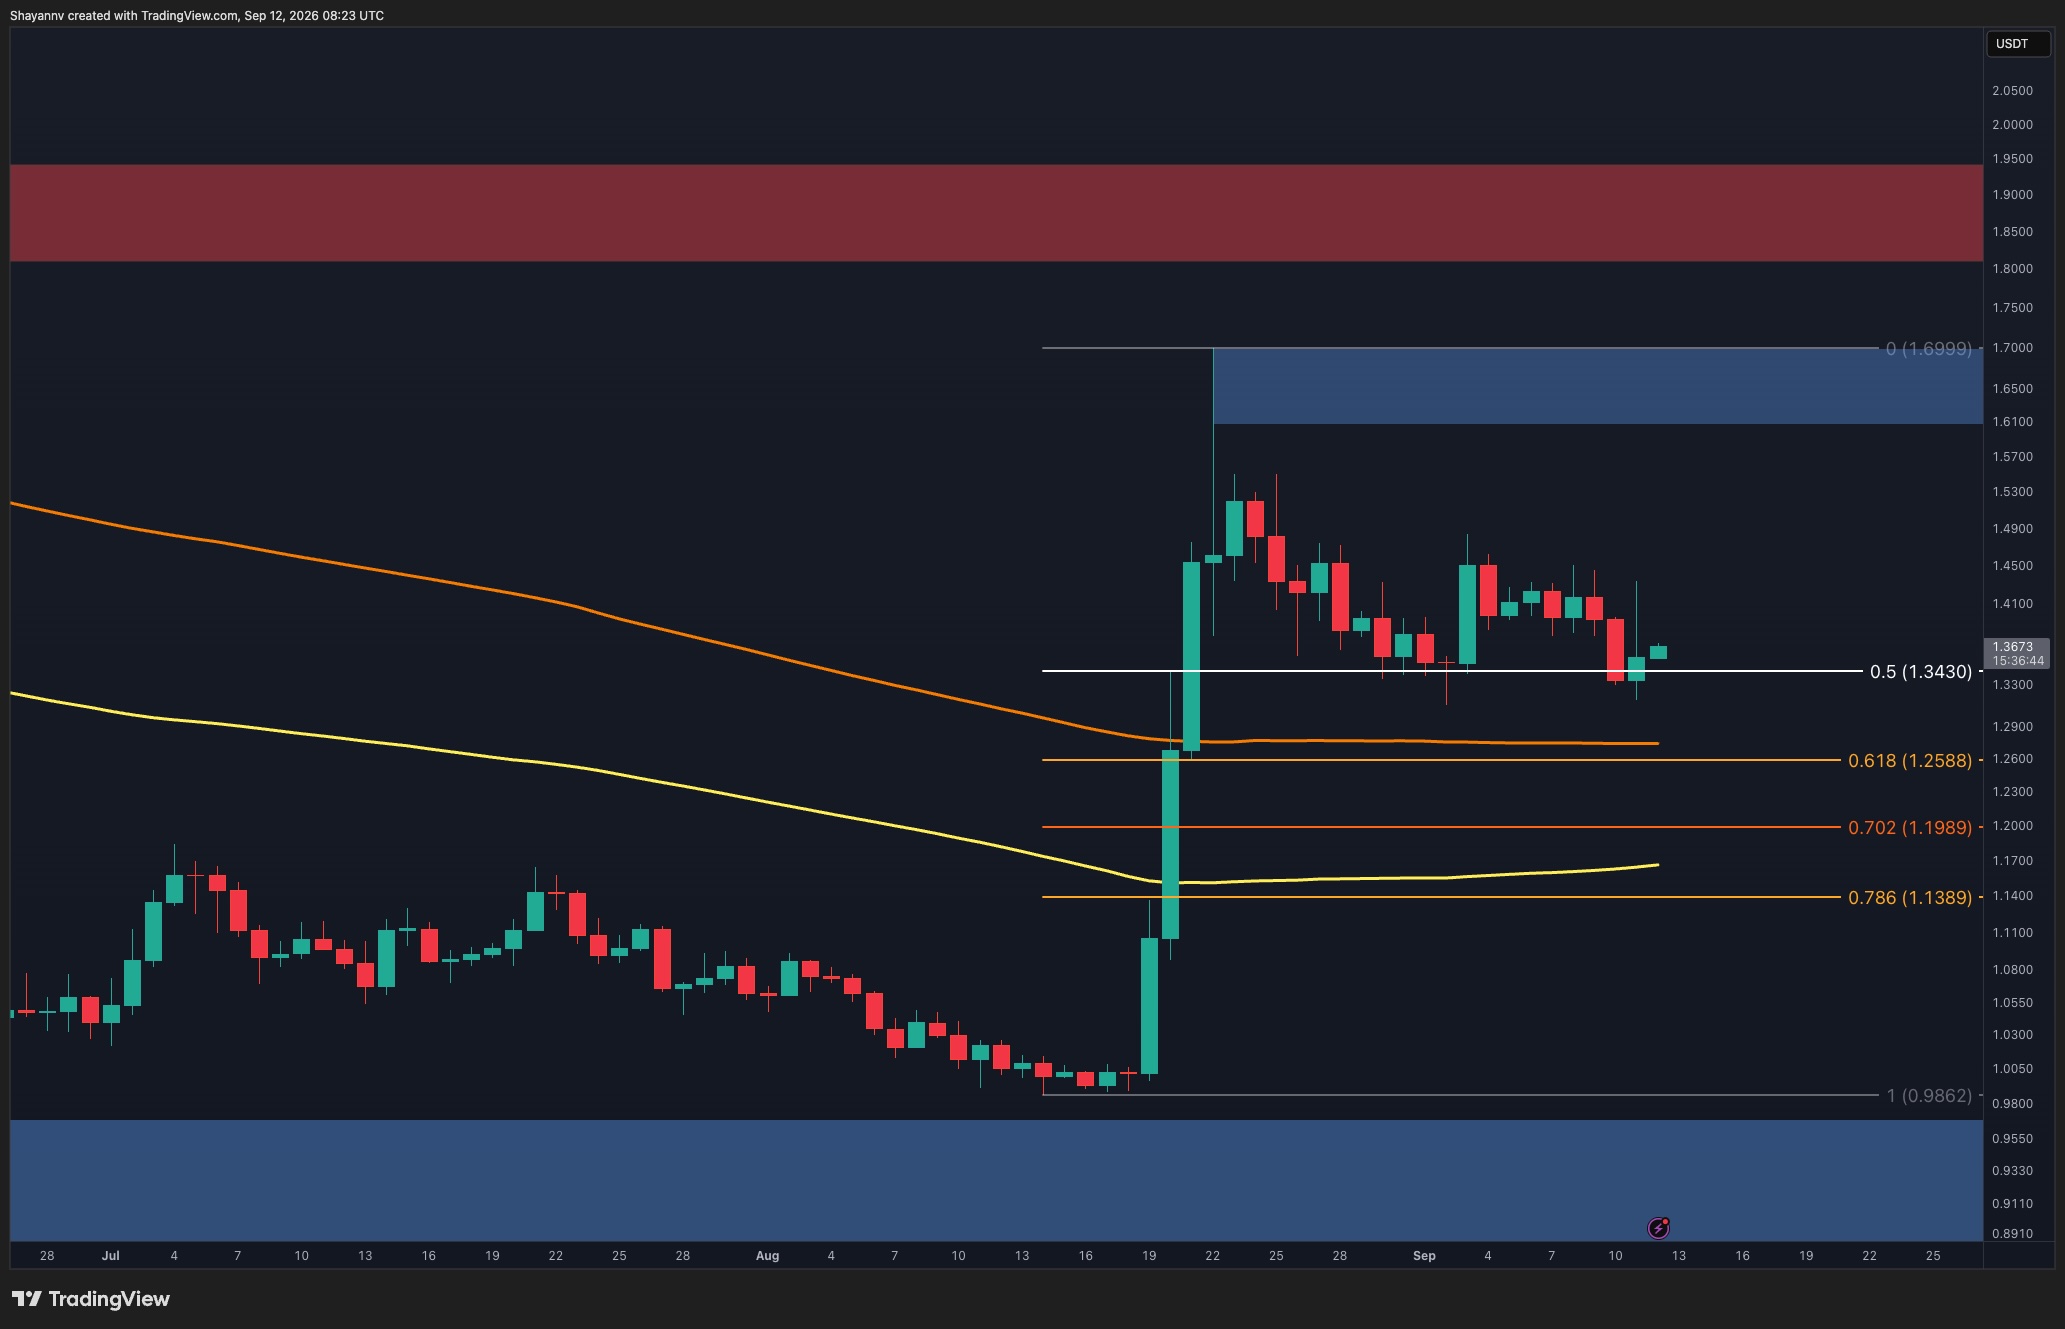
Ripple's XRP has yet to establish a clear direction after its August surge, with repeated rebounds being capped before buyers can regain control. The asset is currently trading around $1.37, close to the 0.5 Fibonacci retracement level at $1.34.
Since rallying from around $0.99 to above $1.50, the price has formed a sequence of lower highs while remaining above the broader support structure, producing a descending channel. The $1.33-$1.34 zone represents an important near-term support area, with buyers currently defending it, though the rebound remains modest.
Key Technical Levels
If the $1.33-$1.34 support gives way, the next important downside target sits around the 0.618 Fibonacci level at $1.26. This area aligns closely with the broader $1.22-$1.27 support zone, making it a particularly significant region for the medium-term structure.
On the upside, XRP would need to recover through the $1.45-$1.50 area before challenging the major $1.61-$1.70 resistance zone. Until then, the price action remains corrective rather than decisively bullish.
4-Hour Chart Analysis
The 4-hour chart emphasizes the gradual compression since the August peak, with XRP continuing to trade inside a descending channel. The upper trendline is approaching the $1.40-$1.42 region and acting as dynamic resistance.
A breakout above the descending trendline and acceptance above the $1.40-$1.42 zone would indicate the correction is losing strength, potentially shifting attention toward $1.45 and higher resistance areas. Conversely, another rejection from the trendline would keep the descending structure intact, potentially exposing the $1.22-$1.27 support zone and deeper support near $1.09-$1.13.