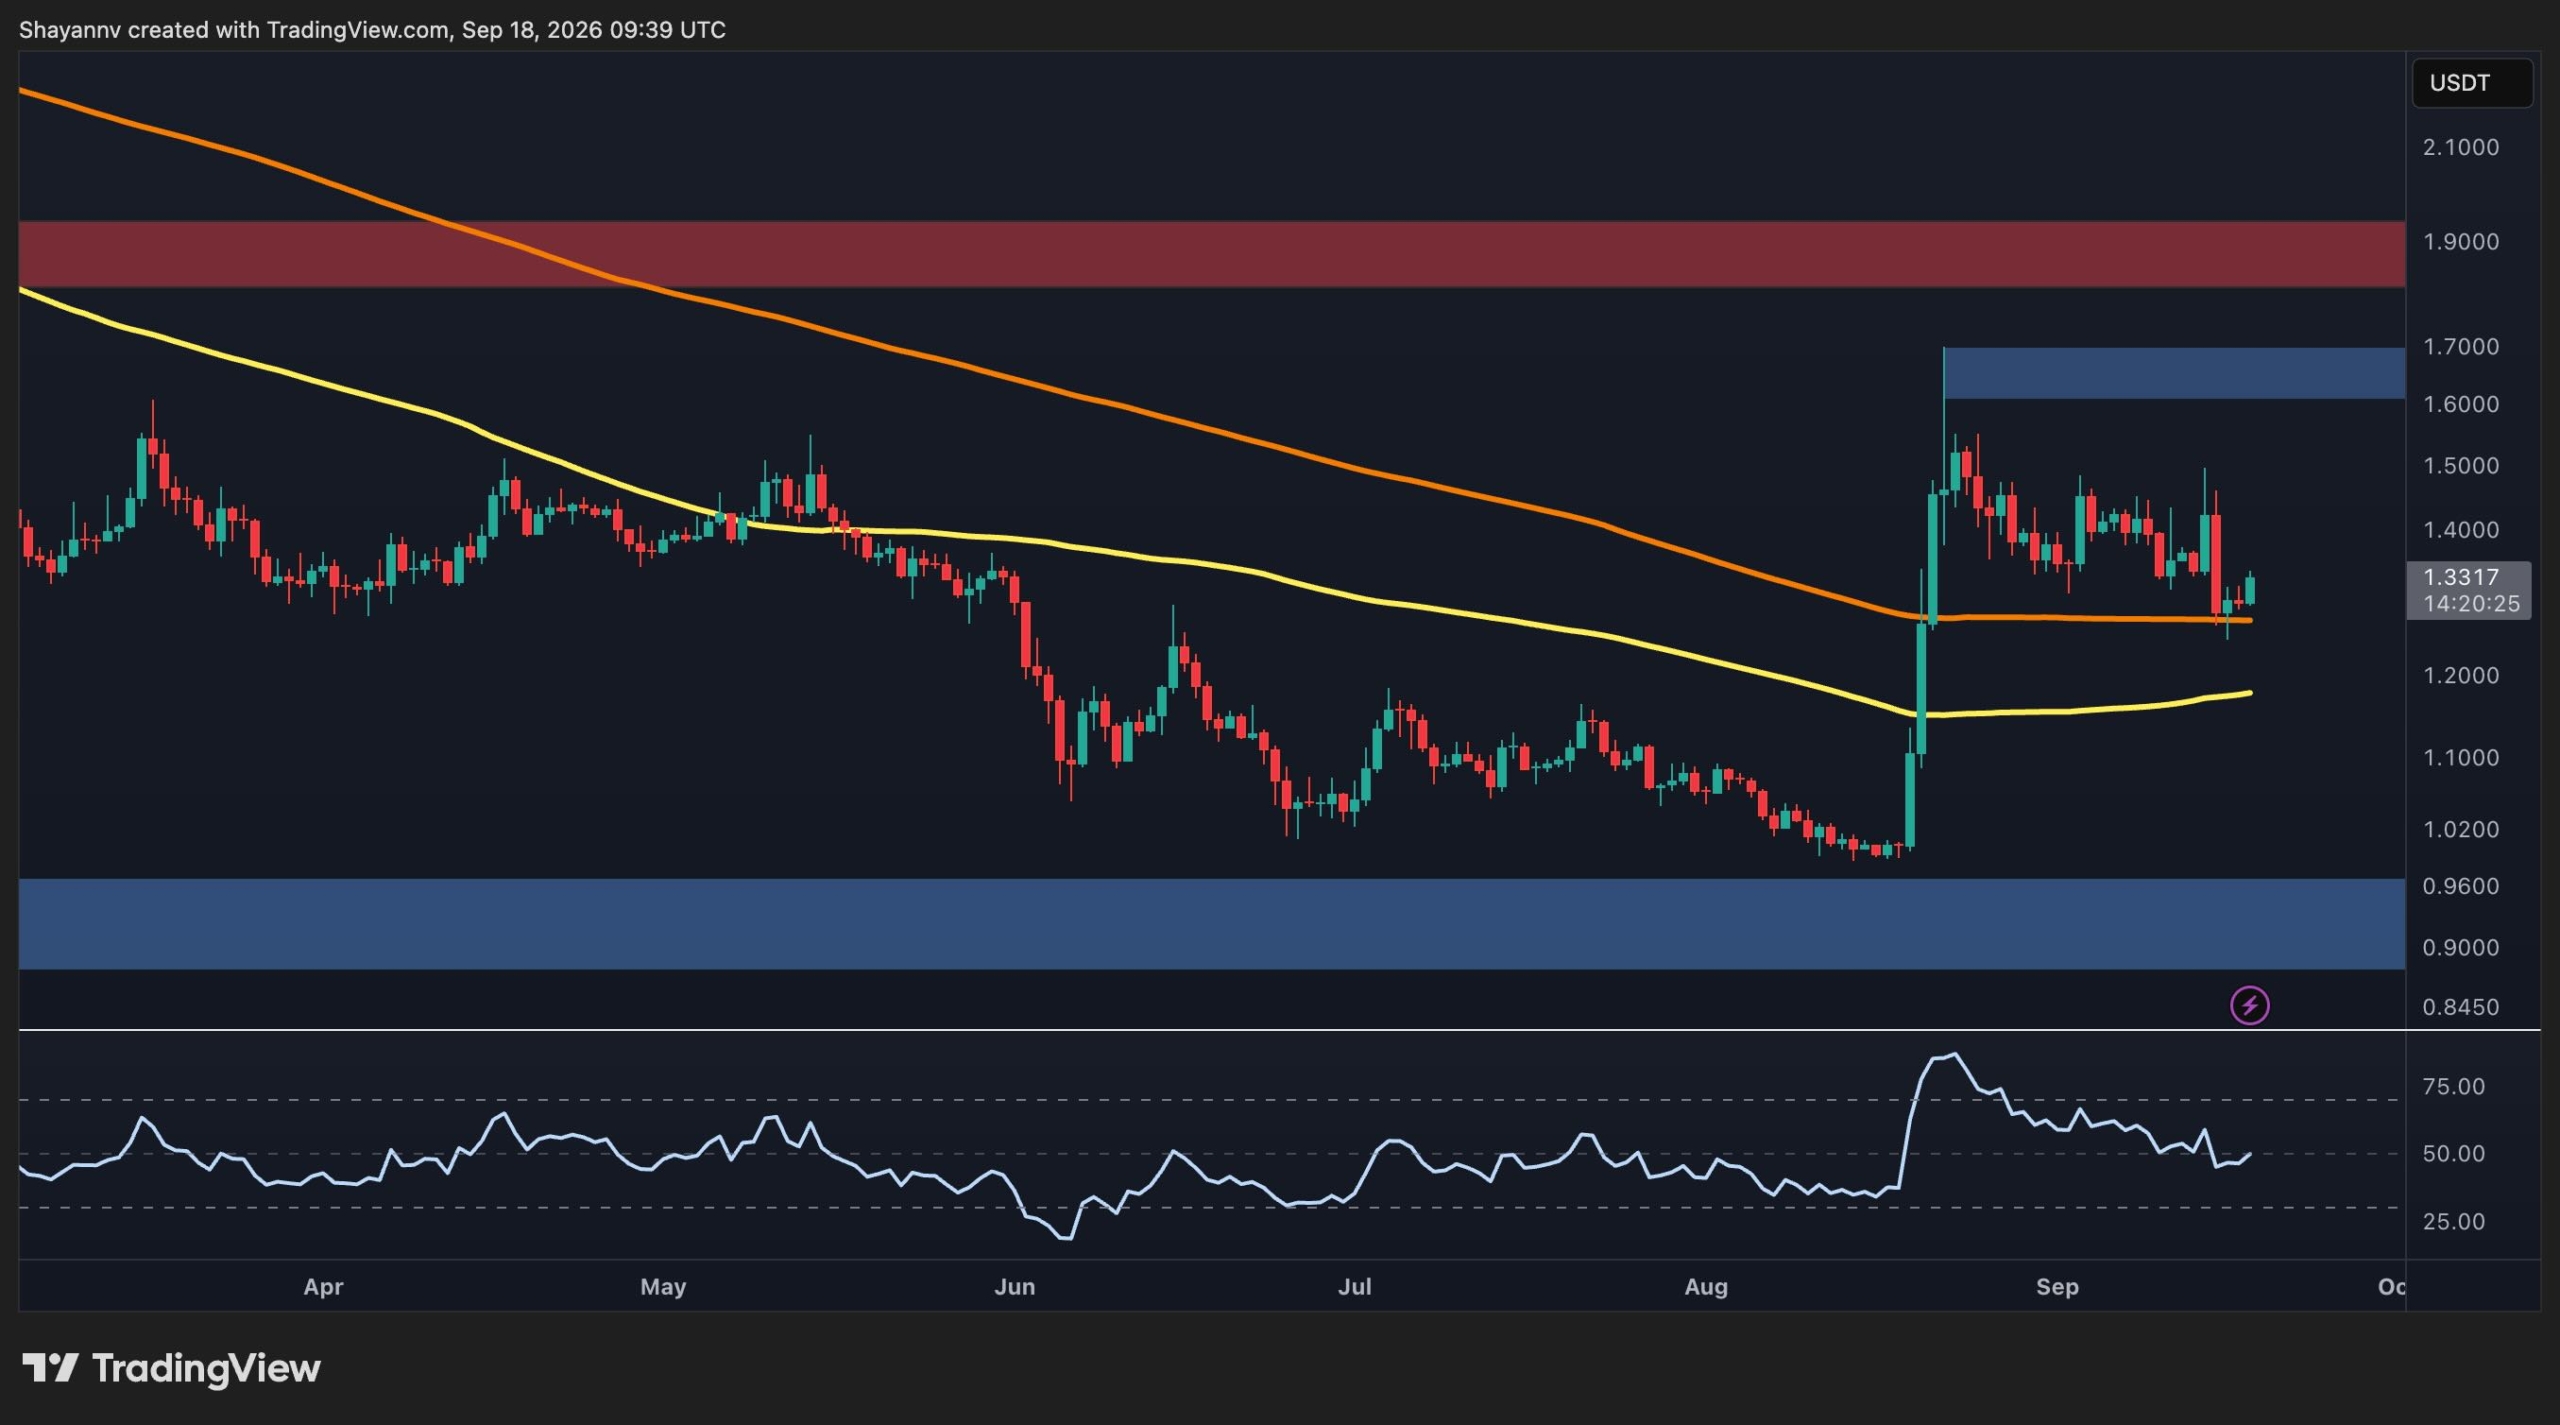
XRP is consolidating after a sharp recovery from the sub-$1.00 area, with the cryptocurrency now trading around $1.35. The recovery has improved the asset's technical structure, though price action remains constrained within key resistance and support levels.
Daily Chart Analysis
On the daily timeframe, XRP rallied from the $1.00 support level to approximately $1.70 before entering a prolonged consolidation phase. The current price of $1.35 sits just above the 200-day moving average at roughly $1.30, an important level for maintaining the recent structural recovery.
The 100-day moving average is positioned lower at around $1.18, providing deeper support if the correction extends further. Overhead resistance remains in the $1.60–$1.70 zone, where the recent swing high formed. A break above this area would put the $1.90 resistance level back into focus. The major structural support zone remains around $1.00, representing a broader invalidation area well below current prices.
4-Hour Chart Perspective
The 4-hour chart presents a more cautious near-term view. XRP has been trading inside a descending channel with both trendlines sloping downward. After rejection near $1.48, the asset declined toward the $1.25 support zone at the channel's lower boundary.
XRP has begun recovering toward $1.35, but faces immediate resistance in the $1.33–$1.37 zone. A clean breakout and hold above this area would improve the short-term structure and could allow the asset to test the channel's upper boundary around $1.40–$1.45. Rejection at this resistance level could send the price back to the $1.25 support zone, with a loss of the lower channel trendline potentially triggering a deeper correction.